. 2014 Jun 4;3:e02535. doi: 10.7554/eLife.02535

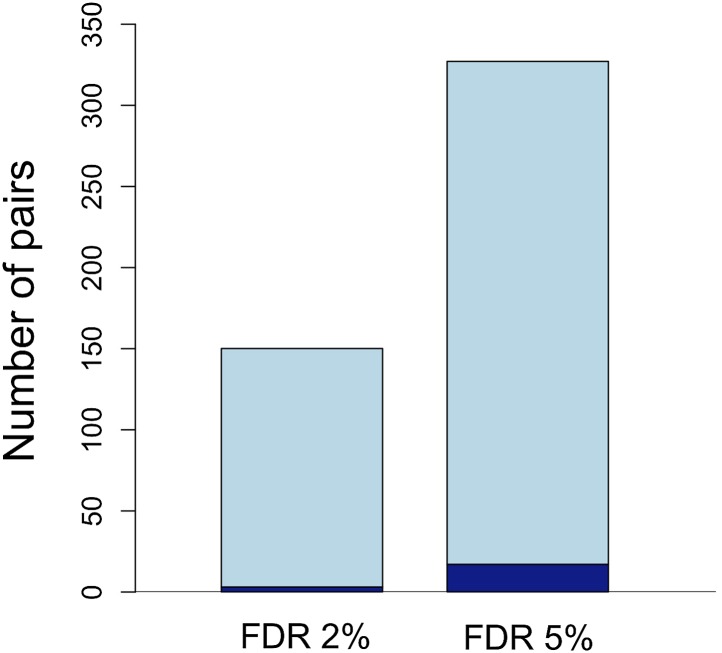
Figure 3. Number of unlinked pairs in significant linkage disequilibrium and expected false discovery rates.

Plot showing number of pairs of sites in significant LD in both populations in the stringent and relaxed data sets (light blue). The expected number of false positives in each data set is shown in dark blue, and was determined by simulation (see main text; Figure 3—figure supplement 1).

DOI: http://dx.doi.org/10.7554/eLife.02535.008

Figure 3.

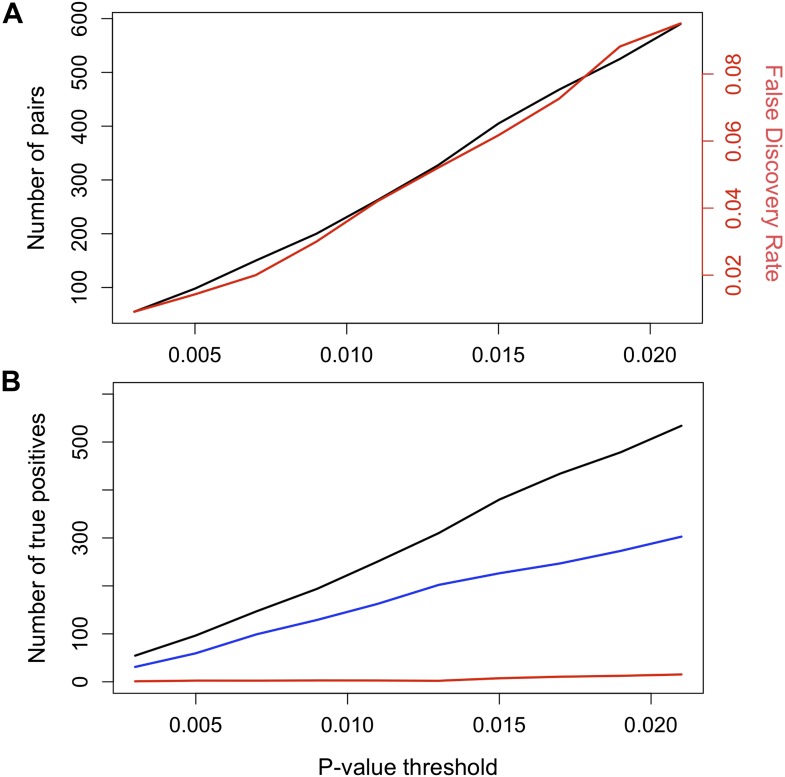
Figure 3—figure supplement 1. False discovery rate (FDR) at different p-value thresholds.

Figure 3—figure supplement 1.

(A) The number of pairs of loci in LD in both populations in black (y-axis left) vs the expected false discovery rate in red (y-axis right) at different p-value thresholds. (B) Estimated number of true positives in the data set at different p-value thresholds for all pairs (black), conspecific pairs (blue), and heterospecific pairs (red). Expected false discovery rate was determined by 1000 simulations randomly permuting markers from the real data in both populations.