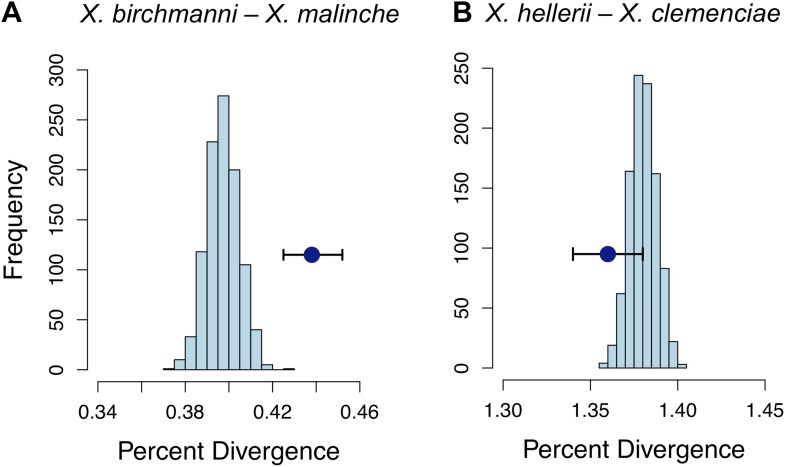
Figure 6. Divergence of LD pairs compared to the genomic background in two species comparisons.
(A) Regions identified in X. birchmanni and X. malinche and (B) orthologous regions in X. hellerii and X. clemenciae. The blue point shows the average divergence for genomic regions within significant LD pairs, and whiskers denote a 95% confidence interval estimated by resampling genomic regions with replacement. The histogram shows the distribution of the average divergence for 1000 null data sets generated by resampling the genomic background without replacement.

