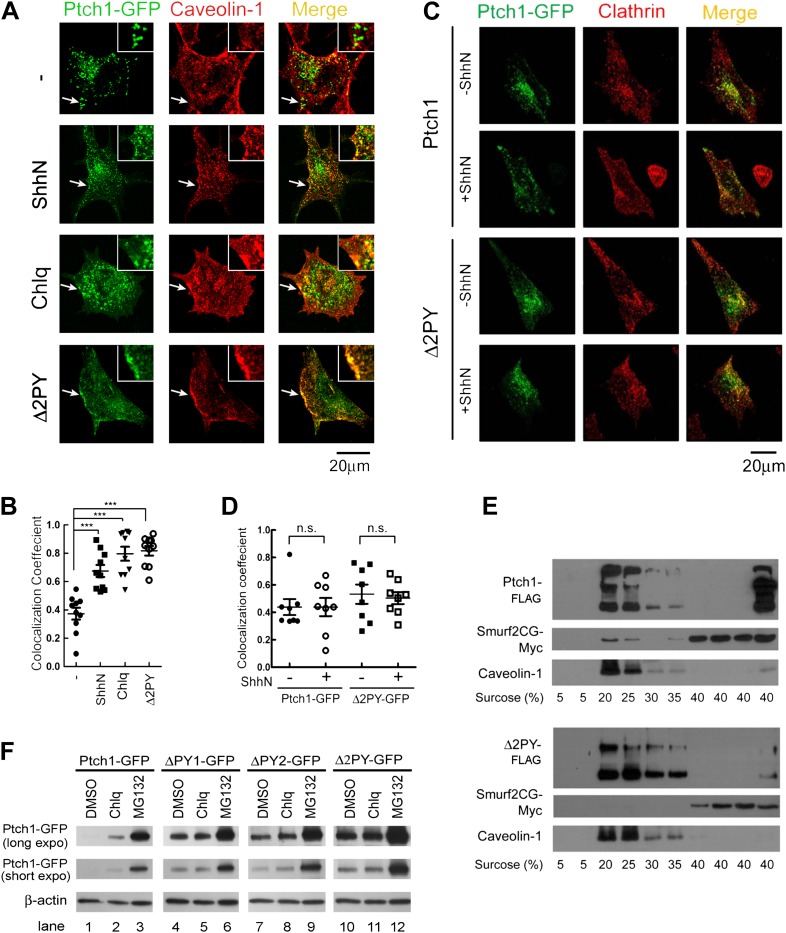
Figure 1. The PPXY motifs define sorting signals from lipid rafts to late endosomes.
(A) Confocal images showing colocalization of exogenously expressed Ptch1-GFP or Δ2PY (green) with native Cav-1 (red) at the rim of the plasma membrane, and (B) calculation of the colocalization coefficients in (A) in transfected MEFs. ShhN-CM and Chlq were added 1 hr prior to fixation. The chamber slides were chilled at 4°C for 20 min and then shifted to 37°C for another 20 min before fixation with 4% paraformaldehyde in PBS. The cells were then permeabilized with 0.5% Triton X-100 and stained with an antibody for Cav-1. (C) Representative images and (D) quantification of colocalization between Ptch1-GFP and clathrin heavy chain. MEFs were transfected with Ptch1-GFP or PtchΔ2PY-GFP, then treated with ShhN or Ctrl medium for 1 hr before fixation. (E) Western analyses of sucrose gradient fractions showing Ptch1-FLAG co-sedimented with Smurf2CG-Myc and Cav-1. Δ2PY was inefficient in bringing Smurf2CG-Myc into Cav-1 positive sedimentation fractions. (F) Western blot analyses of stabilities of Ptch1 and the ‘PPXY’ motif mutants in MEFs. Chlq or MG132 treatment was carried out for 4 hr. The confocal images were taken with a 63x objective, and the insets in 1A were digitally magnified. Bars represent mean ± standard deviation (SD). Statistical analyses were performed by two-tail Student's t test. ***p<0.001, and n.s., not statistically significant (p>0.05).


