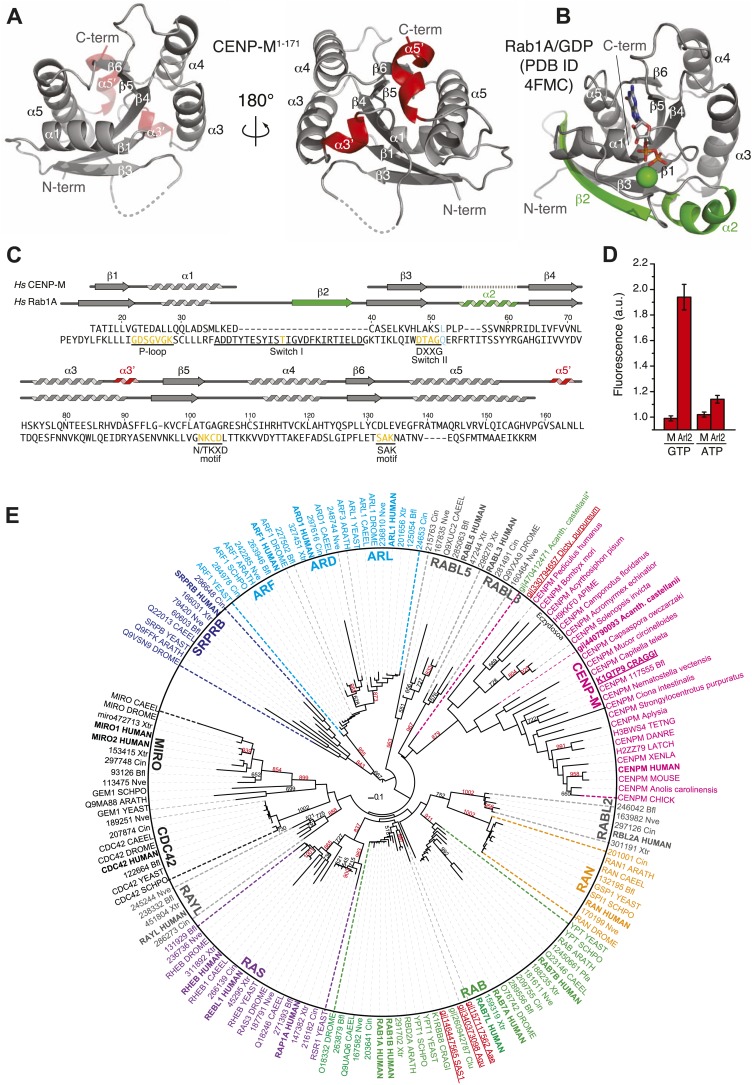
Figure 3. A small G-protein fold in CENP-M.
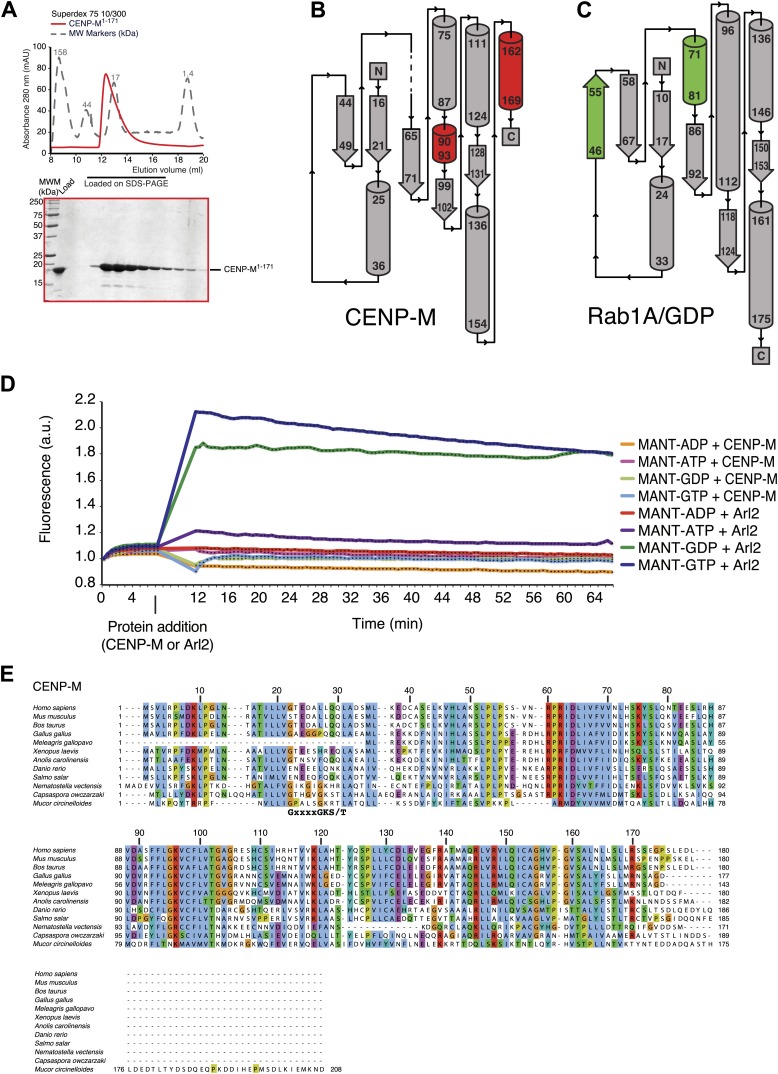
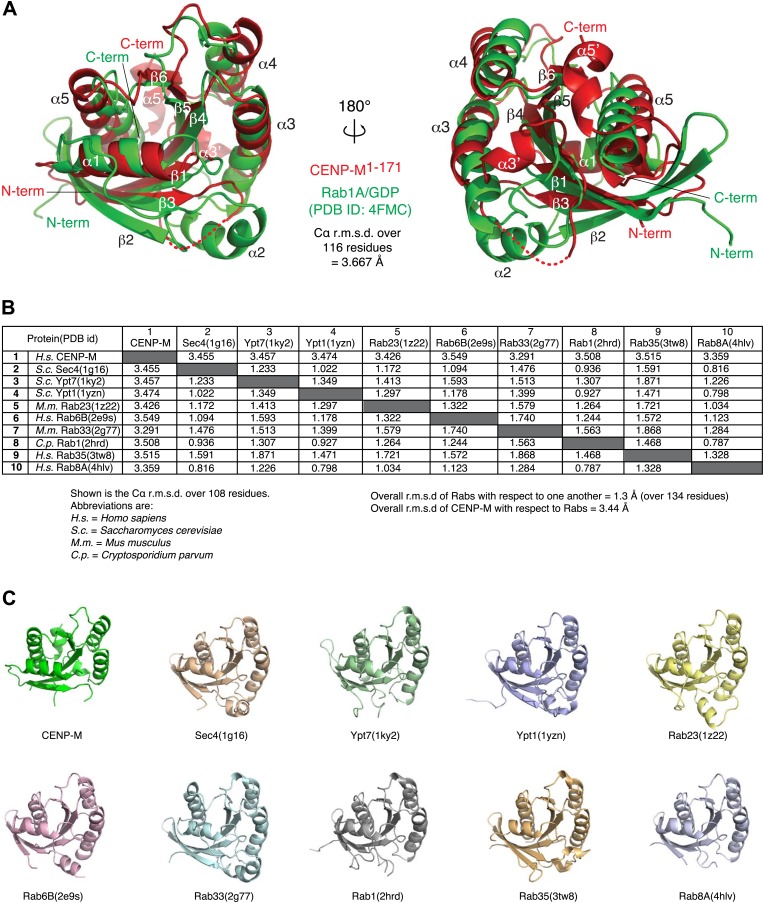
(A) Cartoon model of CENP-M1–171 in two orientations. (B) Cartoon model of Rab1A/GDP (PDB ID 4FMC). (C) Sequence alignment based on the structural superposition of CENP-M1–171 with Rab1A. Conserved elements of small G proteins are in yellow. A conserved residue involved in catalysis and targeted by activating mutations in Ras is in light blue. Secondary structure elements of CENP-M1–171 not present in Rab1A/GDP are in red, while those present in Rab1A/GDP but not in CENP-M1–171 are in green. (D) Experiments with N-methylanthraniloyl (MANT) derivatives of GTP and ATP. Binding of MANT-GTP or MANT-ATP to the small GTPase Arl2 (‘Arl2’) or CENP-M (‘M’) was monitored at an emission wavelength of 440 nm (See Figure 3—figure supplement 1, panel D). The histogram shows the time-averaged fluorescence value after addition of the indicated proteins to a solution of the indicated MANT nucleotides, normalized against the time-averaged value prior to protein addition. Only the addition of Arl2 to MANT-GTP (or MANT-GDP, see Figure 3—figure supplement 1, panel D) gave a clear increase in signal indicative of a physical interaction of the MANT nucleotide with Arl2. (E) Unrooted maximum likelihood tree of 157 sequences. Shown are members of classical small GTPase families in many species, covering a wide range of evolutionary points. Gray names are reclassified families (Rojas et al., 2012). Bold names are human sequences. CENP-M sequences are pink. Uppercase indicates Uniprot code for proteins. 3-code labels are: Nve (Nematostella vectensis), Bfl (Branchiostoma floridae), Xtr (Xenopus tropicalis), and Cin (Ciona intestinalis). Numbers on the left of 3-code labels are accession numbers corresponding to the DOE Joint Genome Institute (JGI) database. Red and underlined names are Genbank gi identifiers found in iterative hmmer searches against non-redundant database. Acanth. castellanii indicates Acantanthamoeba castellanii, where * indicates that this entry is annotated as a RAS protein. Dicty. purpureum is Dictyostelium purpureum, Aae is Aedes aegypti, Aqu is Amphimedon queenslandica (sponge), and Clu is Clavispora lusitaniae (fungi). Red numbers within the tree indicate number of trees corresponding to more than 80% of statistical support for a given group, whereas black indicates values below 80%. Only representative numbers have been shown for clarity.


