. 2014 Jul 8;3:e02978. doi: 10.7554/eLife.02978

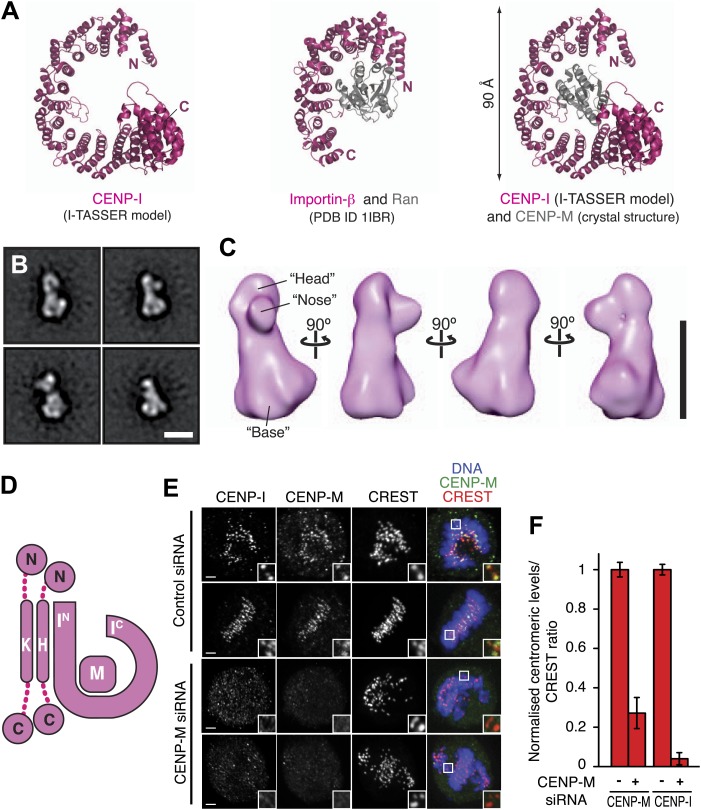
Figure 4. Structural organization of the HIKM complex.

(A) Cartoon representation of the CENP-I model generated by program I-TASSER (left), of the Importin-β/Ran complex (middle), and of a hypothetical structure between CENP-I and CENP-M modeled on the Importin-β/Ran complex (right). A scoring function (C-score) associated with I-TASSER models estimates accuracy of structure predictions. C-score is typically in a range from −5 to 2, where a higher score reflects a model of better quality. Both false positive and false negative rates are estimated to be below 0.1 when a C-score >−1.5 is displayed (Zhang, 2008). The CENP-I model is associated with a C-score of −1. (B) Representative class averages of the negatively stained HIKM complex. Figure 4—figure supplement 3 shows the complete set of class averages. Scale bar = 10 nm. (C) A 3D reconstruction of HIKM complex from negatively stained particles at ∼22 Å resolution. Scale bar = 10 nm. (D) Summary of interactions in the CENP-HIKM complex. The central regions of CENP-H and CENP-K may form an extended parallel interaction, possibly through an α-helical arrangement, which interacts more or less co-linearly with the N-terminal region of CENP-I (IN). Additional globular domains may be present at the N- and C-termini of CENP-H and CENP-K. The entire sequence of CENP-I may fold as a helical solenoid. CENP-M does not interact with CENP-H/K and may bind near the concave surface of the predicted CENP-I solenoid, becoming largely buried. (E) siRNA depletion of endogenous CENP-M abrogates CENP-I kinetochore localization in HeLa cells. Representative cells displayed here are the same shown in Figure 1D, but with addition of CENP-I staining (left panels). Insets display a higher magnification of regions outlined by white boxes. Scale bars = 2 µm. (F) CENP-M and CENP-I kinetochore levels from the experiment illustrated in E. Quantification for CENP-M kinetochore levels are the same shown in Figure 1D and were performed as previously described. Graphs and bars indicate mean ± SEM.

DOI: http://dx.doi.org/10.7554/eLife.02978.013

Figure 4.

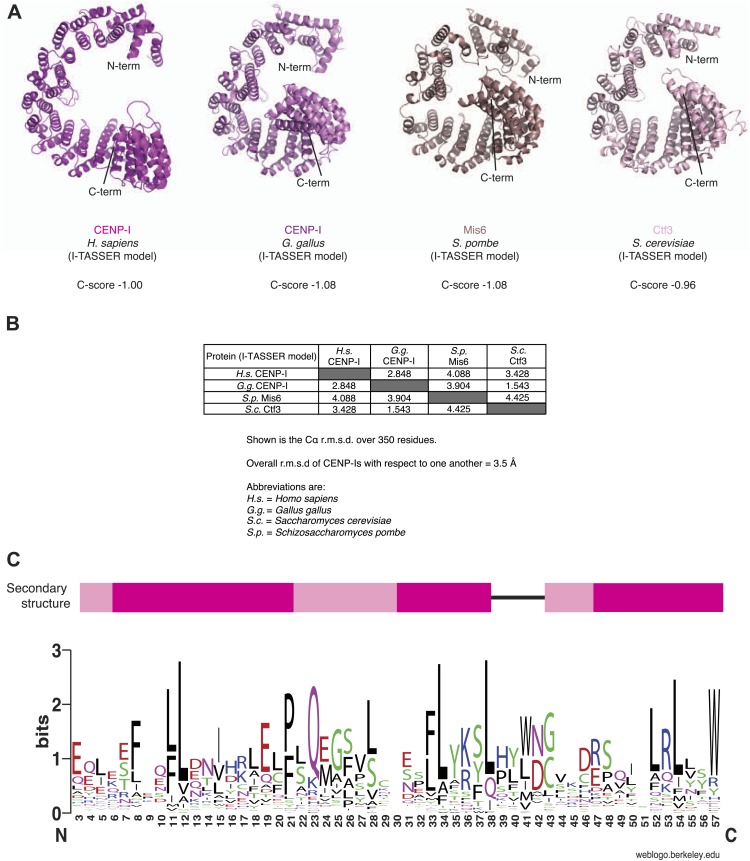
Figure 4—figure supplement 1. Structural predictions on CENP-I orthologs.

Figure 4—figure supplement 1.

(A) The sequences of human CENP-I plus three orthologues were submitted to the I-TASSER server (http://zhanglab.ccmb.med.umich.edu/I-TASSER/). The best models from each search were superposed on the human model and displayed. The C-score is shown for each model. (B) Summary of the superposition for each homology model. Importantly, while similar to one another, the models are also sufficiently different, as a result of different templates being used for homology modeling. (C) Analysis of α-helical repeat elements. Repeat elements within the human CENP-I sequence were identified by the RADAR server (http://www.ebi.ac.uk/Tools/pfa/radar/) (Heger and Holm, 2000). RADAR also detected repeat elements in the equivalent region for chicken CENP-I, Mis6, and Ctf3. From a multiple sequence alignment of 25 CENP-I orthologs, the three repeat regions were all aligned against each other. The multiple sequence alignment was then submitted to the WebLogo server (http://weblogo.berkeley.edu/logo.cgi) (Crooks et al., 2004) to generate a consensus sequence. The secondary structure for the repeats, based on the homology models, is shown above. Consistent α-helical elements are shown in pink; variable elements are shown in light pink; unstructured regions are represented as a black line. The repeat is rather divergent, and indeed is sometimes comprised of three rather than two α-helices.
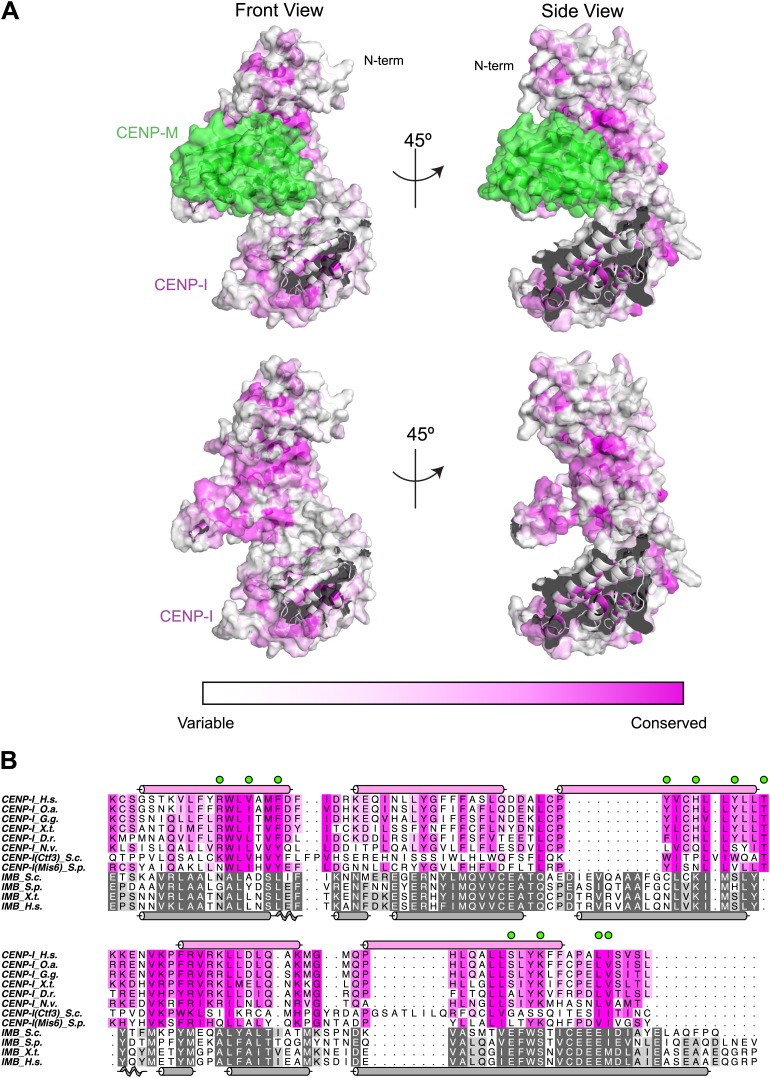
Figure 4—figure supplement 2. Conservation mapped on the CENP-I model.

Figure 4—figure supplement 2.

(A) Surface representation of the CENP-M/I model (as shown in Figure 4). The C-terminal part of the CENP-I model has been removed to show the concave surface with clarity. Residues are colored from white to magenta according to conservation within 23 different CENP-I orthologues. (B) A representative sequence alignment of eight CENP-I sequences from different organisms is shown, with a focus on the region that, according to the model, may be involved in CENP-M binding. Surface residues predicted to be in contact with CENP-M are highlighted with green circles. A comparison of four importin-β (ImpB) orthologues is shown to demonstrate that while many residues are conserved between CENP-I and ImpB (consistent with a similar fold) those residues that might contact CENP-M are divergent (consistent with binding a different ligand). Species abbreviations are as follows H.s., Homo sapiens; O.s., Ornithorhynchus anatinus; G.g., Gallus gallus; X.t., Xenopus tropicalis; D.r., Danio rerio; N.v.; Nematostella vectensis; S.c., Saccharomyces cerevisiae S288C; S.p., Schizosaccharomyces pombe.
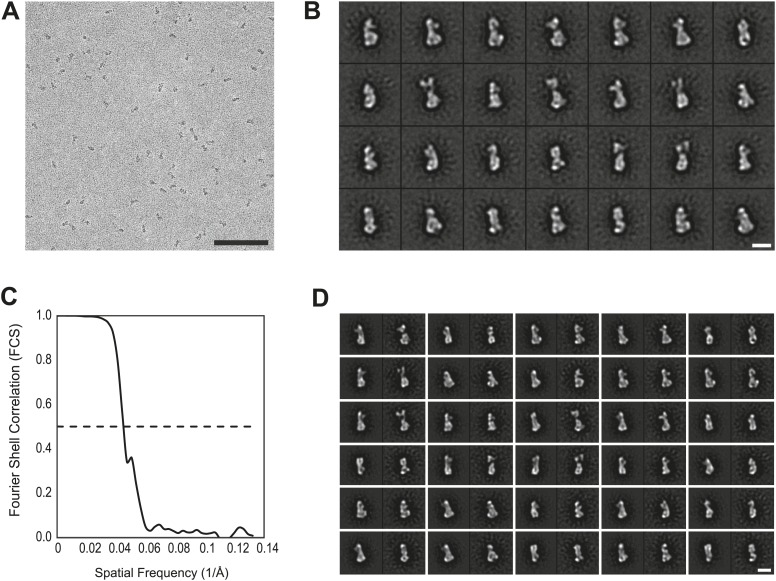
Figure 4—figure supplement 3. EM analysis.

Figure 4—figure supplement 3.

(A) Representative electron micrograph area of the negatively stained CENP-HIKM complex. Scale bar = 100 nm. (B) Collection of class averages of the CENP-HIKM complex derived from a data set of 5958 single particles. Selected classes are shown in Figure 4B. Scale bar = 10 nm. (C) Fourier shell correlation (FSC) curves of the negative stain reconstruction of the CENP-HIKM complex. The resolution was estimated by the FSC 0.5 criterion to be 22 Å. (D) Reprojections of the 3D reconstruction paired with their corresponding class averages. Scale bar = 10 nm.
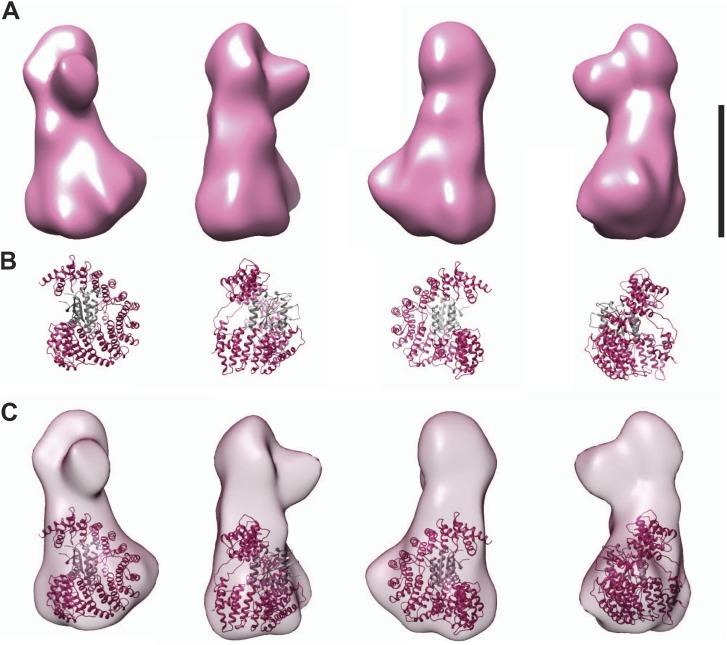
Figure 4—figure supplement 4. Fitting the CENP-I/M model in the EM density.

Figure 4—figure supplement 4.

(A) A 3D reconstruction of HIKM complex from negatively stained particles at ∼22 Å resolution (already shown in Figure 4C). Scale bar = 10 nm. (B) Four orientations of the CENP-I/M model built by I-TASSER (see Figure 4A, right). (C) Tentative manual fitting of the CENP-I/M model into the EM density. The CENP-I/M model fits snugly in the ‘base’ density, leaving empty space in the ‘head’ and ‘nose’ domains, which is therefore predicted to host CENP-H/K.