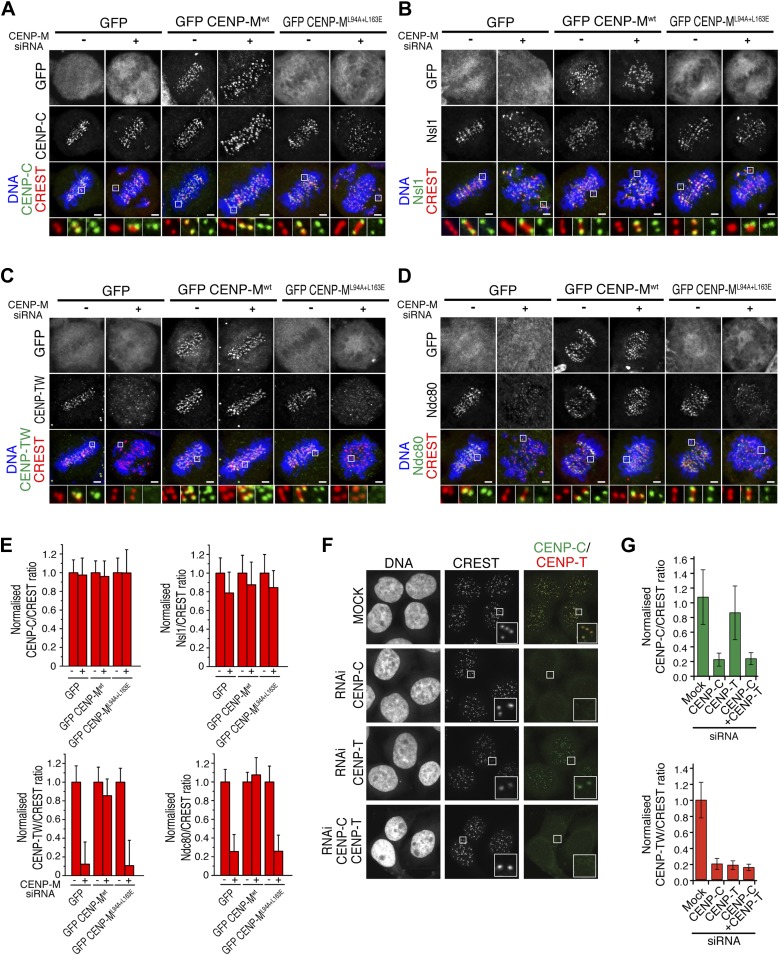
Figure 6. Significance of the CENP-M/CENP-I interaction for kinetochore assembly.
(A–D) Representative images of the localization of kinetochore proteins in HeLa Flp-In T-REx cells treated with siRNA for endogenous CENP-M and expressing the indicated siRNA-resistant GFP-CENP-M fusions. Scale bars = 2 µm. (E) Quantification, for experiments A–D, of the kinetochore levels of the indicated proteins normalized to CREST. Graphs and bars indicate mean ± SEM. (F) Depletion of CENP-C abrogates kinetochore accumulation of CENP-T/W. Representative images of HeLa cells treated with siRNA for CENP-C or CENP-T and arrested in G2 with the Cdk1 inhibitor RO-3306 (‘Materials and methods’). Following fixation, cells were immunostained for CENP-C, CENP-T/W and CREST. DNA was stained with DAPI. Scale bars = 10 µm. (G) Quantification, for experiment F, of the kinetochore levels of the indicated proteins normalized to CREST kinetochore signal. Graphs and bars indicate mean ± SEM.

