
Figure 1.
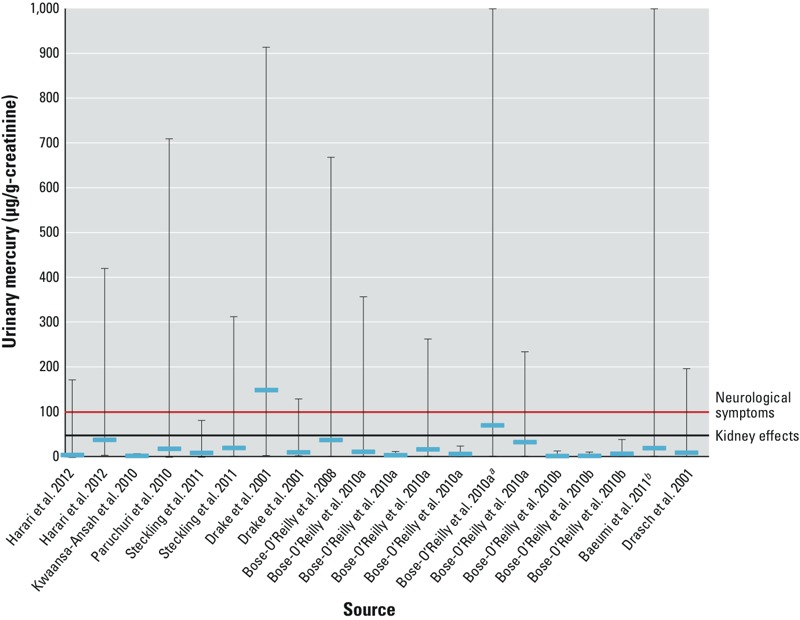
Means (horizontal blue lines) and ranges (vertical lines) of urinary Hg found in ASGM populations. The red line indicating “Neurological symptoms” designates the 100 μg/g-creatinine value for neurological effects identified by WHO (1991). The black line indicating “Kidney effects” designates the 50 μg/g-creatinine concentration at which renal tubular effects are expected to occur (WHO 2000). For more information, see Supplemental Material, Table S4. References that appear on the x-axis more than once indicate that the study included more than one study group [e.g., merchants and miners in Harari et al. (2012)]. aThe highest value for data in this category was 1697.39 μ/g-creatinine. bThe lowest value for data in this study was < LOD; the highest value was 1697 μg/g-creatinine.