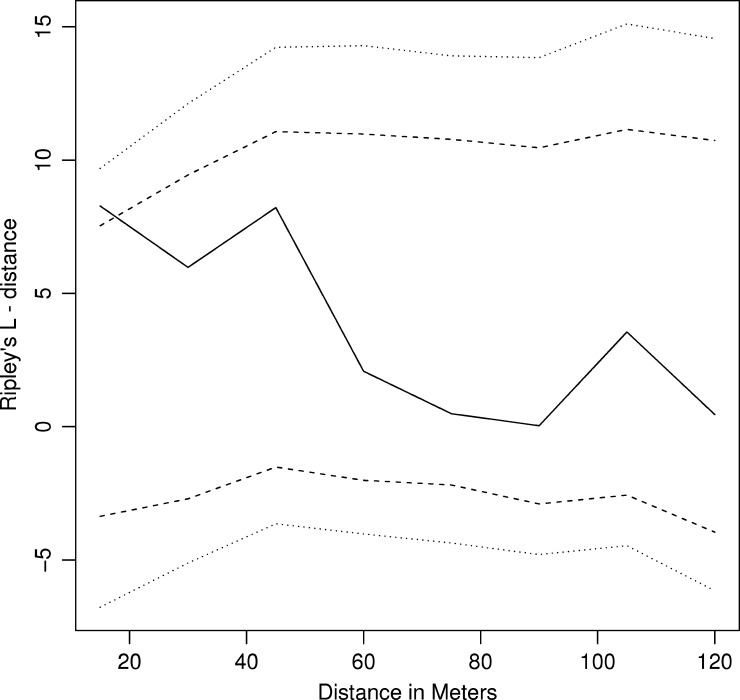
Figure 4.
Ripley's L function. Analysis of spatial clustering of reported infestations among respondents in a census tract of Philadelphia, Pennsylvania, May–July of 2013. Solid black line = observed clustering; area between dashed lines = 95% confidence interval; area between dotted lines = 95% confidence interval with Bonferroni correction (99.375% of replicates).

