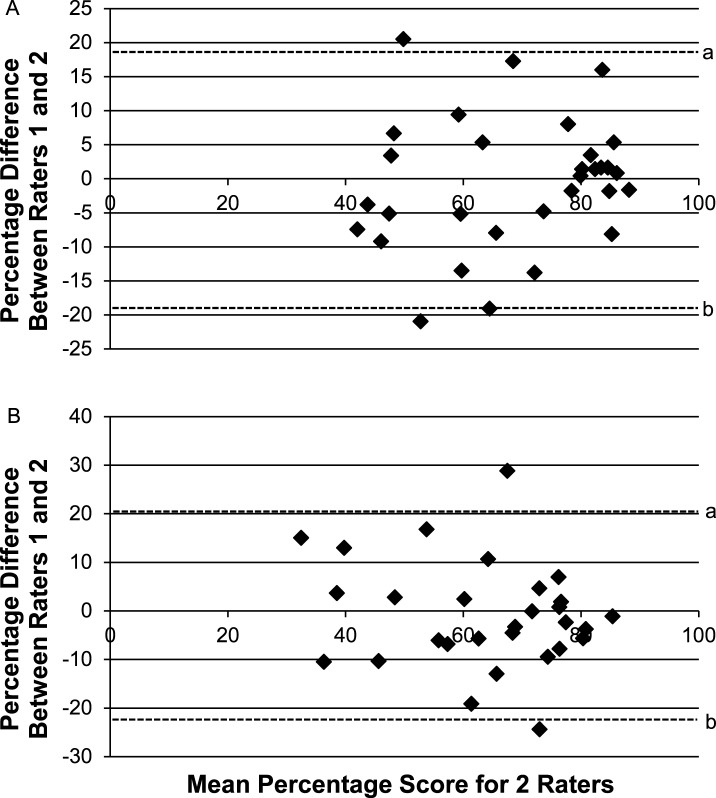
Figure.
Bland-Altman plots measured in percentage scores for the knee and shoulder examinations depicting differences between raters 1 and 2 plotted against the mean score of those 2 raters. A, In the knee scenario, the upper (18.20%) and lower (−19.62%) limits of agreement demonstrate that 95% of the raters fell within this range. B, In the shoulder scenario, the upper (20.63%) and lower (−22.53%) limits of agreement demonstrate that 95% of the raters fell within this range. a Indicates the upper limit of agreement (95%). b Indicates the lower limit of agreement (95%).

