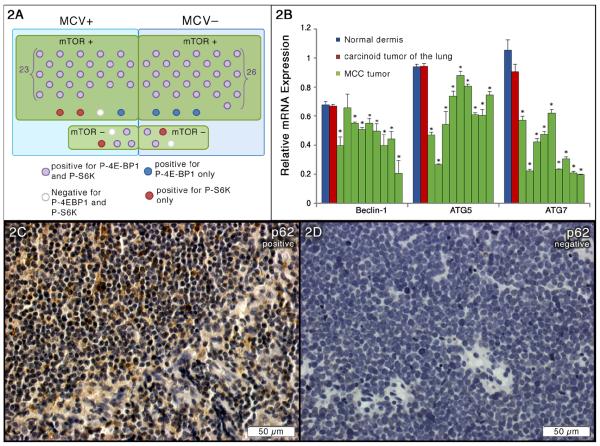
Figure 2. Suppressed autophagy in MCC tissues.
(A) mTOR activation in relation to MCV status in MCC TMA samples. (B) qRT-PCR analysis of autophagy-related gene expressions in 9 fresh MCC tumors. Samples were run in triplicate and normalized to MRPS2 mRNA to determine relative expression (means ± SEM). *P < 0.05 compared with controls. (C) Representative positive immunohistochemical staining of p62 in sections from MCC TMA. (D) Representative negative immunohistochemical staining of p62 in sections from MCC TMA.

