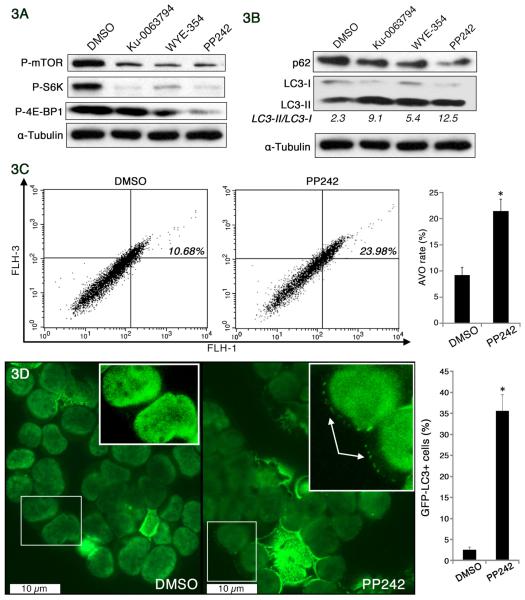
Figure 3. Increased autophagy upon mTOR inhibition in a primary human Merkel cell carcinoma cell line (MCC-2).
(A) Inhibition of mTOR pathway by mTOR kinase inhibitors. MCC-2 cells were treated with WYE354 (3μM), PP242 (2.5μM), and Ku-0063794 (5μM) for 24h, respectively. Lysates were prepared and subjected to immunoblotting analysis with indicated antibodies. (B) Induction of autophagy through inhibition of mTOR. MCC-2 cells were treated with mTOR kinase inhibitors in the presence of the lysosomal protease inhibitors E64d (10 μg/ml) and pepstatin A (10 μg/ml) for 24h, and cell lysates were subjected to immunoblotting against LC3-I, LC3-II and p62. The LC3-II/LC3-I ratio was calculated using ImageJ software. The increased LC3 II/LC3 I ratio and decreased p62 accumulation were indicative of increased autophagy. Tubulin was used as a loading control. (C) Induction of acidic vesicular organelles (AVOs) in PP242-treated MCC-2 cells. MCC-2 cells treated with PP242 (2.5μM) for 24h were subsequently stained with acridine orange (0.01 μg/ml) for 15 min and then subjected to flow cytometric analysis. FL1-H indicates green fluorescence intensity (cytoplasm and nucleus), while FL3-H shows red fluorescence intensity (AVOs). Results shown are the means ± SEM of at least three independent experiments. *P < 0.05 compared with DMSO-treated cells. (D) Punctate pattern of MCC-2-GFP-LC3 upon mTOR inhibition. MCC-2 cells were transduced with lentivirus expression of GFP-LC3 and treated with DMSO and PP242 (2.5μM) for 24h, respectively. Images were captured using a fluorescence microscope. Cells were considered positive if they had more than three MCC-2-GFP-LC3 dots and a minimum of 100 GFP positive cells per sample were counted. Data are presented as a percentage of the total number of MCC-2 positive GFP positive cells visualized. Results shown are the means ± SEM of at least three independent experiments. *P < 0.05 compared with DMSO-treated cells.

