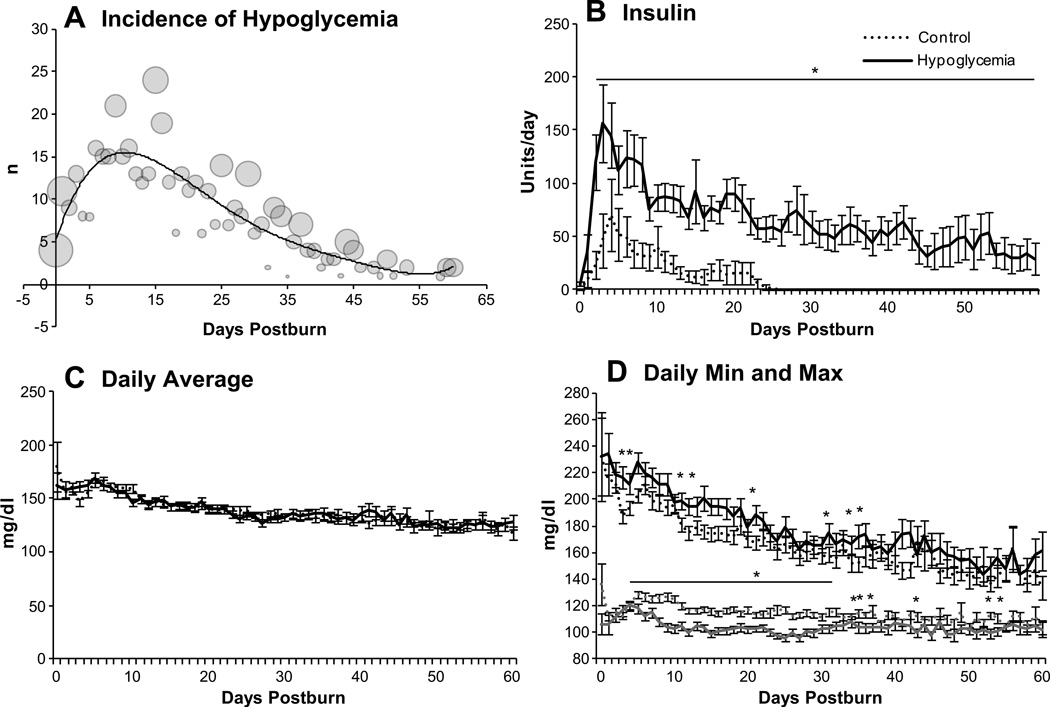
Figure 3.
Glucose metabolism over time. The incidence of hypoglycemic episodes (A) peaked during the critical phase two weeks from burn. Sizes of the circles show the percentage of measurements below 60 mg/dl for the whole patient population for each day up to day 60. The following graphs show the pattern of insulin administration (B), daily average glucose levels (C), and daily minimum and maximum glucose readings (D) for propensity score matched groups. *Hypoglycemia vs. control p<0.05.

