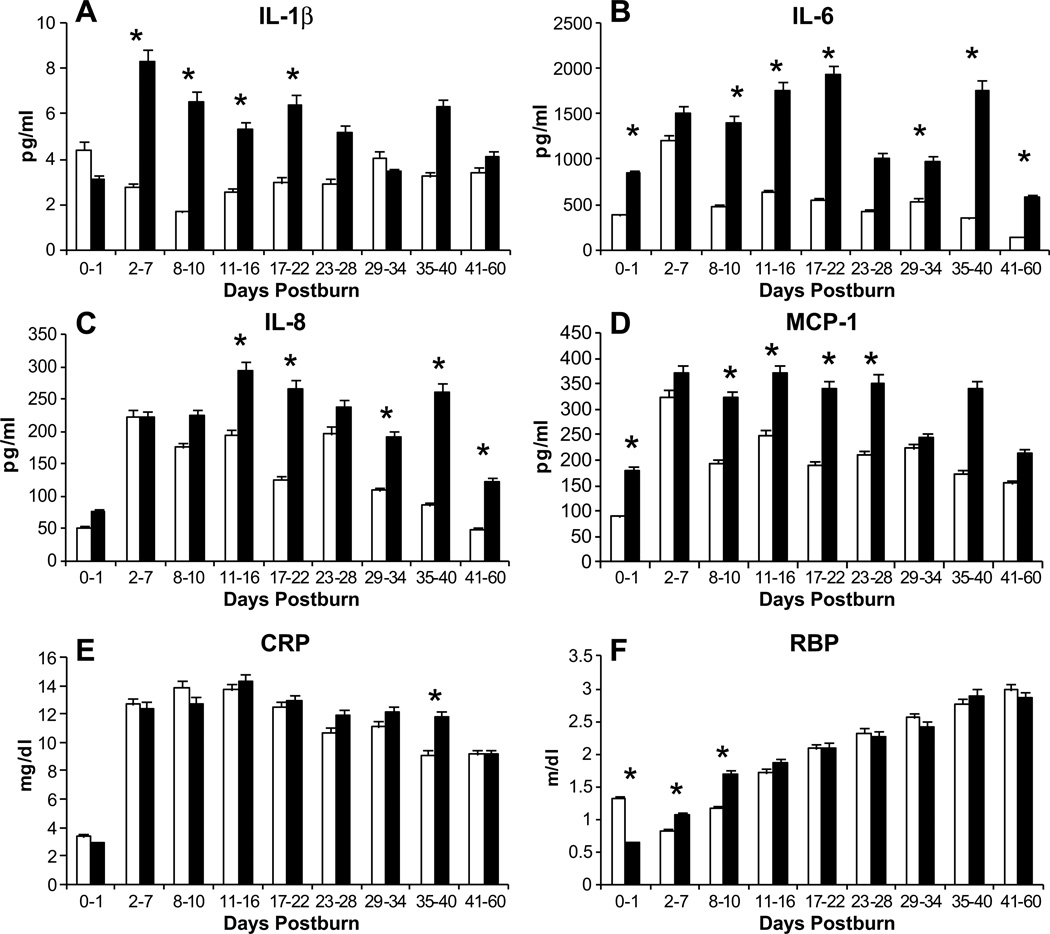
Figure 4.
Profiles of inflammatory markers such as Cytokines (A–D) and acute phase proteins (E) of the matched groups. Cytokines showed a significantly higher expression in the hypoglycemia group, whereas inflammatory proteins such as CRP and RBP (F) displayed only minor differences among the groups. *Hypoglycemia vs. control p<0.05.

