Figure 2.

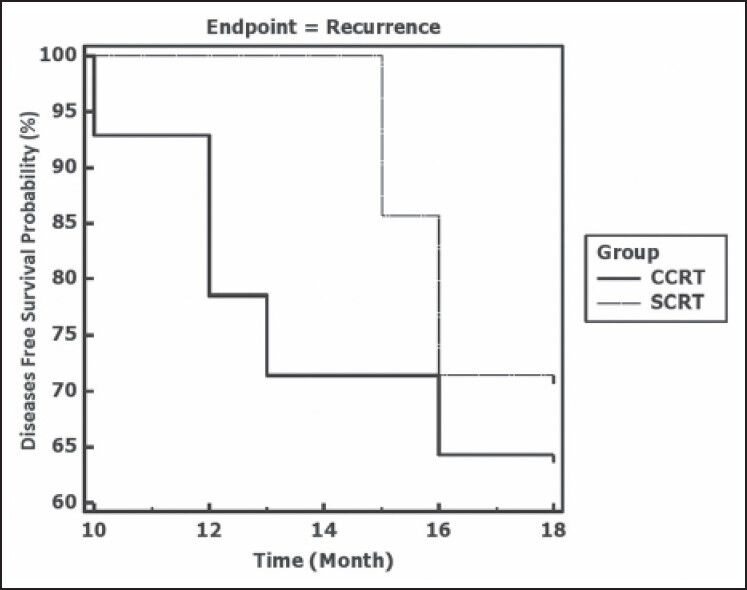
Kaplan-Meier plots depicting disease free survival in the two study groups CCRT (concurrent chemoradiotherapy) and SCRT (sequential chemoradiotherapy). Log rank test indicates a nonsignificant difference (P = 0.641)

Kaplan-Meier plots depicting disease free survival in the two study groups CCRT (concurrent chemoradiotherapy) and SCRT (sequential chemoradiotherapy). Log rank test indicates a nonsignificant difference (P = 0.641)