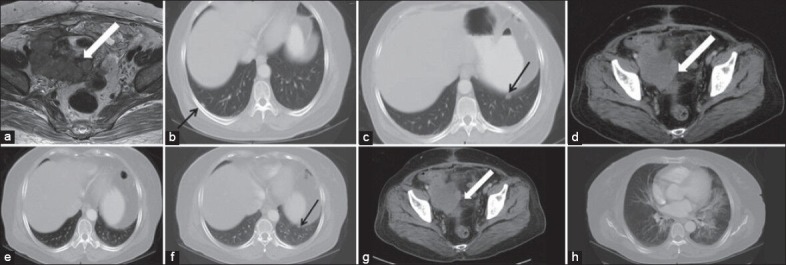
Figure 1.

(a) Magnetic resonance imaging pelvis showing intermediate signal SOL with cystic areas and necrosis (block arrows). (b and c) Contrast enhanced computed tomography (CECT) thorax shows bilateral pleural nodules (arrows). (d-f) CECT 8 weeks after therapy shows 10% reduction of the dimensions of the pelvic mass and disappearance of right sided pleural nodule while left pleural nodule persists. (g and h) CECT after another 8 weeks shows further reduction in the size of the pelvic mass while left lower lobe of lung and perihilar regions show interstitial pneumonitis
