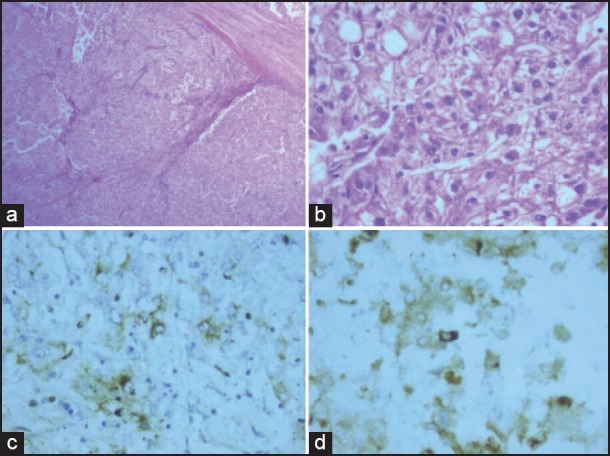
Figure 2.

Pelvic mass. (a) Section shows infiltrating neoplasm arranged in lobules separated by thick and thin fibrovascular septae with lymphoplasmacytic infiltrate (H and E, ×40). (b) Tumor cells with abundant pale vacuolated cytoplasm, with moderate nuclear atypia and variably prominent nucleoli (H and E, ×400). (c) Patchy positivity for HMB-45 (×400). (d) Patchy positivity for melan-A (×400)
