
Figure 7.
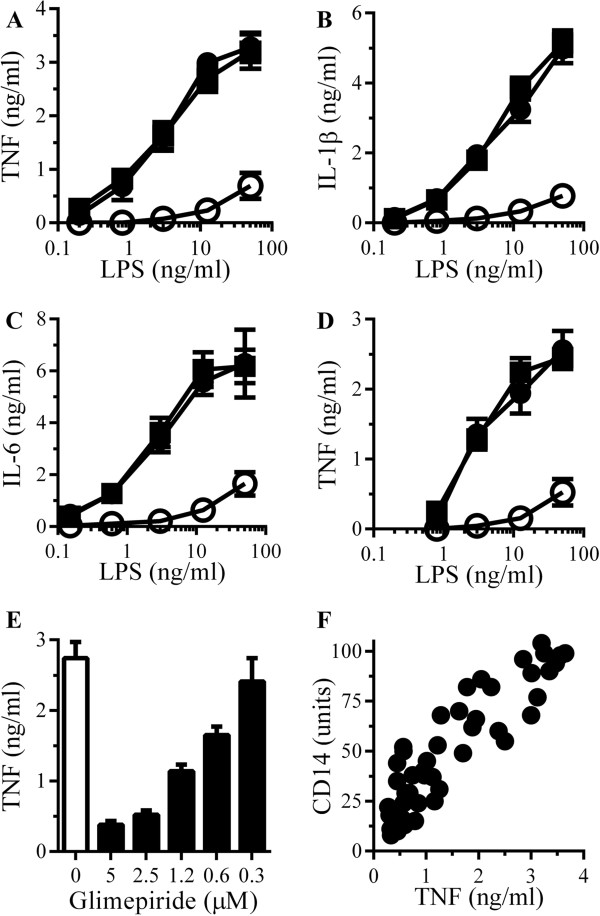
Glimepiride reduces lipopolysaccharide (LPS)-induced cytokine secretion. (A) The concentrations of TNF produced by RAW 264 cells pre-treated with control medium (●), 5 μM glimepiride (○) or 5 μM glipizide (■) and incubated with LPS. Values are means ± SD from triplicate experiments performed 4 times, n = 12. (B) The concentrations of IL-1β produced by RAW 264 cells pre-treated with control medium (●), 5 μM glimepiride (○) or 5 μM glipizide (■) and incubated with LPS. Values are means ± SD from triplicate experiments performed 4 times, n = 12. (C) The concentrations of IL-6 produced by RAW 264 cells pre-treated with control medium (●), 5 μM glimepiride (○) or 5 μM glipizide (■) and incubated with LPS. Values are means ± SD from triplicate experiments performed 4 times, n = 12. (D) The concentrations of TNF produced by microglial cells pre-treated with control medium (●), 5 μM glimepiride (○) or 5 μM glipizide (■) and incubated with LPS. Values are means ± SD from triplicate experiments performed 4 times, n = 12. (E) The concentrations of TNF produced by RAW 264 cells pre-treated with control medium (□) or glimepiride as shown (■) and incubated with 10 ng/ml LPS. Values are means ± SD from triplicate experiments performed 3 times, n = 9. (F) There was a significant correlation between the CD14 content of RAW 264 cells treated with glimepiride (0.3 to 5 μM) and the concentrations of TNF produced in response to 10 ng/ml LPS, Pearson’s coefficient = 0.886.