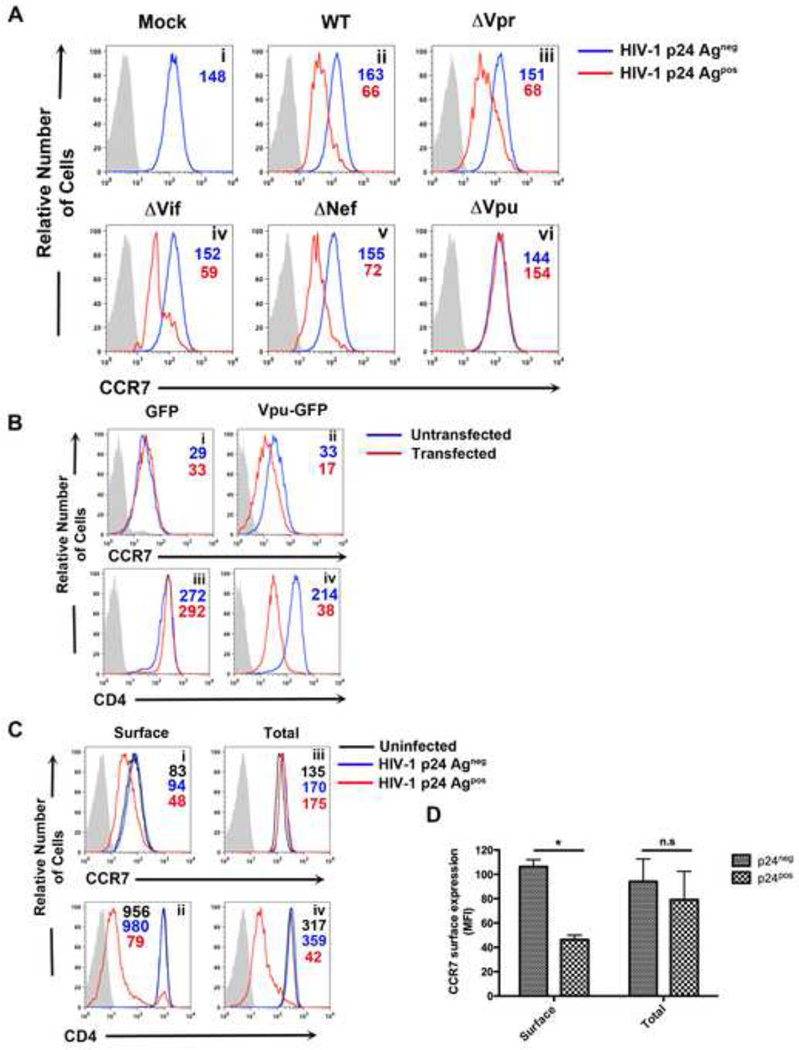
Figure 2. HIV-1 Vpu is necessary and sufficient for surface downmodulation, but not degradation, of CCR7.
A) Primary CD4+ T cells were either mock infected (i) or infected with DHIV (ii), DHIVAVpr (iii), DHIVAVif (iv), DHIVANef (v) or DHIVAVpu (vi). Two days later, cells were assessed for surface levels of CCR7 in p24Gagneg (blue line) and p24Gagpos cells (red line). Gray shaded histograms represent IgG matched isotype controls.
B) CEM-CCRF cells were nucleofected with 2µg of either a GFP or Vpu-GFP expression vector. Twenty-four hours post-transfection, relative surface levels of CCR7 (i and iii) or CD4 (ii and iv) were measured. Histograms depict a comparison between untransfected (blue line) and transfected (red line) cells relative to IgG matched control (gray shaded histogram). Figure is representative of three independent experiments.
C) Relative surface levels of CCR7 (i) and CD4 (ii) were assessed two days post infection with DHIV, as in A. In addition, cells were permeabilized and co-stained with antibodies for either CCR7 (iii) or CD4 (iv) along with antibody for p24Gag. HIV-1 p24Gagpos cells and p24Gagneg cells are represented by red or blue line, respectively. Uninfected cells (black line) were used as a control along with an IgG matched isotype (gray shaded histogram).
D) Data depicts mean fluorescence intensity (MFI) values of surface and total levels of CCR7 from three independent experiments. Data was normalized by setting MFI values from uninfected (mock) cells to 100% and is depicted graphically as +/− mean SEM. (*, P <0.05)

