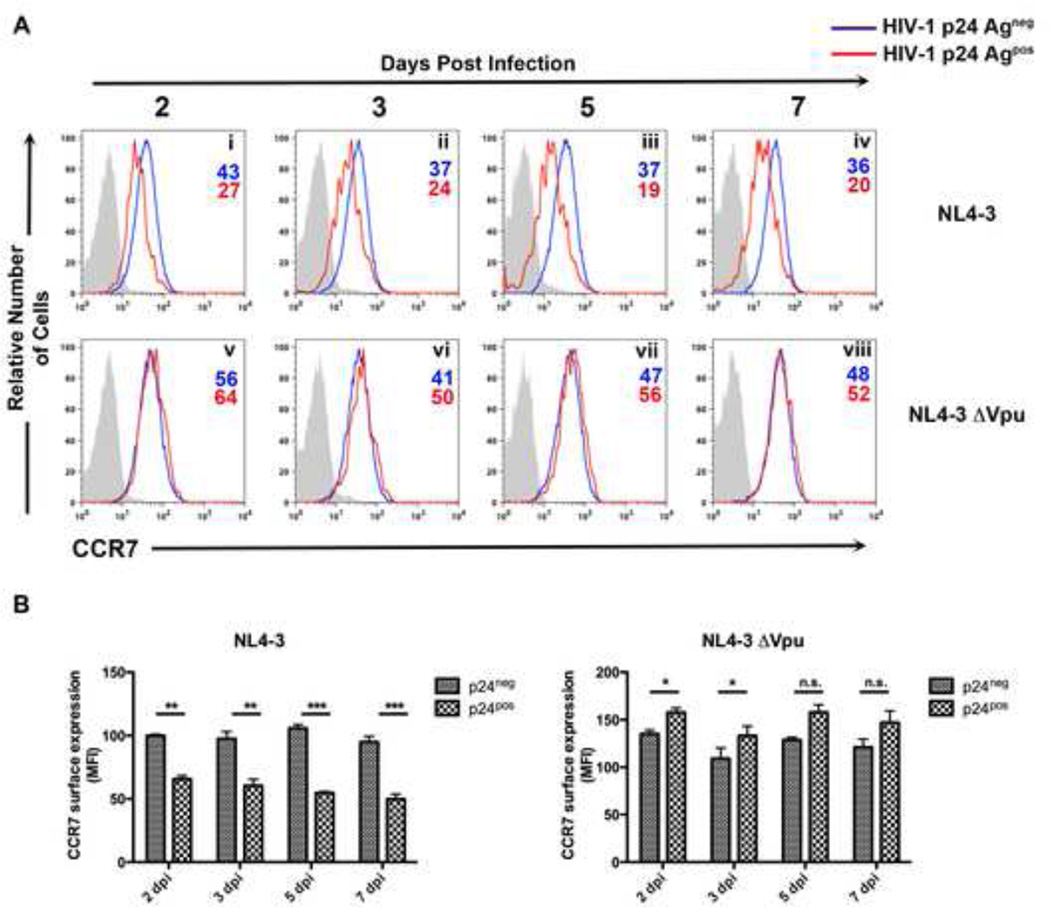
Figure 3. Vpu downregulates CCR7 in the context of a spreading infection.
A) Primary CD4+ T cells were infected with either HIV-1NL4-3 or HIV-1NL4-3ΔVpu at an MOI=.1. At 2, 3, 5 and 7 days post infection, cells were surface stained for CCR7 and permeabilized for detection of p24Gag. Histograms represent either p24Gagneg cells (blue line), p24Gagpos cells (red line) or an IgG matched isotype (gray shaded histogram).
B) Data depicts mean fluorescence intensity (MFI) values of surface CCR7 levels from either HIV-1NL4-3 (left) or HIV-1NL4-3ΔVpu (right) infected cells. Normalization was achieved by setting MFI values from uninfected (mock) cells to 100% and is depicted graphically as +/− mean SEM. Data representative of three independent experiments from three separate donors (*, P < 0.05; **, P < 0.01; ***, P < 0.001)

