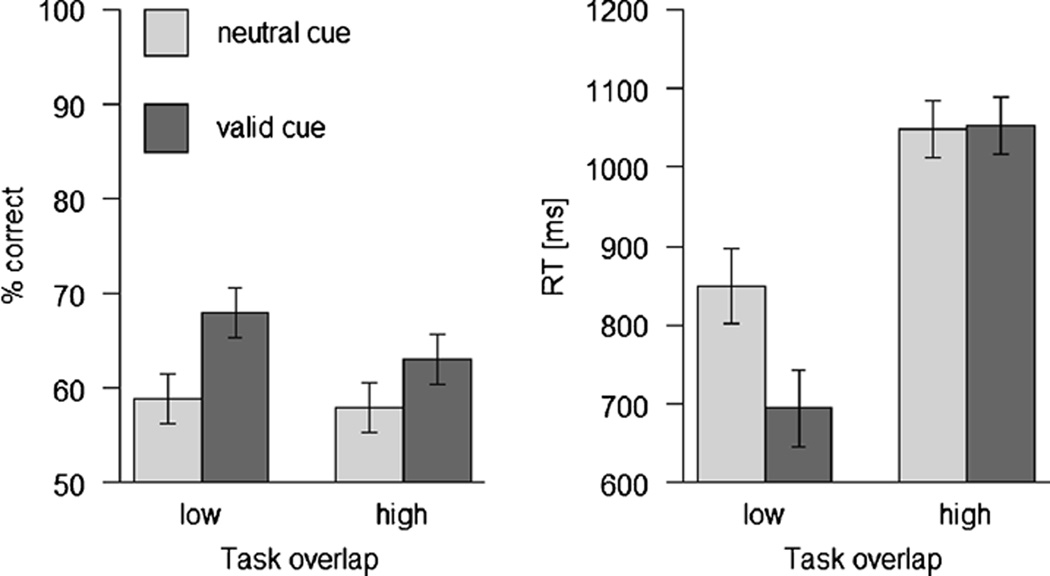
Fig. 3.
Results of the retro-cue task in Experiment 2 as a function of cue type and task overlap. Left panel, mean percentage correct; right panel, mean reaction times (RTs). Errors bars are 95 % within-subjects confidence intervals calculated separately for each task overlap condition (Pfister & Janczyk, 2013)

