
Fig. 1.
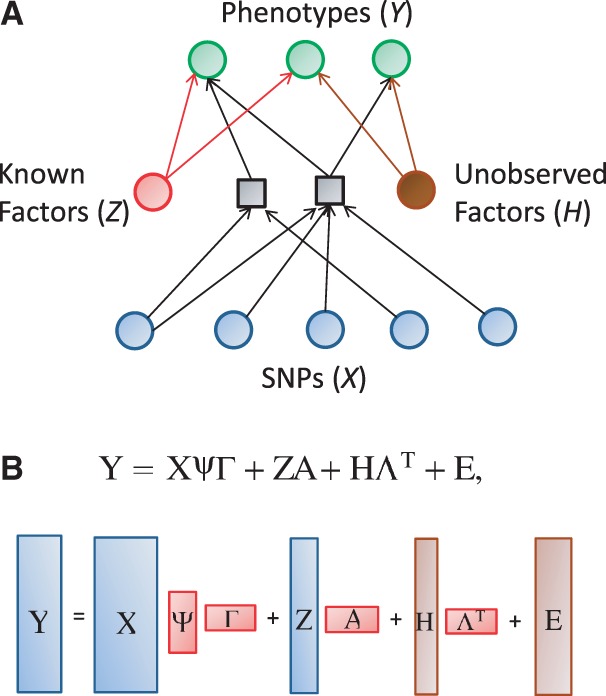
Graphical illustration of the model. (A) The variables and dependencies between them. The phenotypes Y are assumed to be affected by known factors, such as age or sex, unknown factors, such as batch effects caused by varying experimental conditions, and the SNPs. The influence of the SNPs is mediated by unknown combinations of the original SNPs, represented by black squares. (B) The same model using matrix notation. Matrices containing the observed variables, Y (the phenotypes), X (the SNPs) and Z (known factors), are blue. The regression coefficient matrices are red. Note that the coefficient matrix for the SNP effects is written as a product of two matrices,  and Γ, corresponding to a low-rank approximation to an unconstrained coefficient matrix. The brown matrices comprise unobserved variables, H (unknown factors) and E (noise terms)