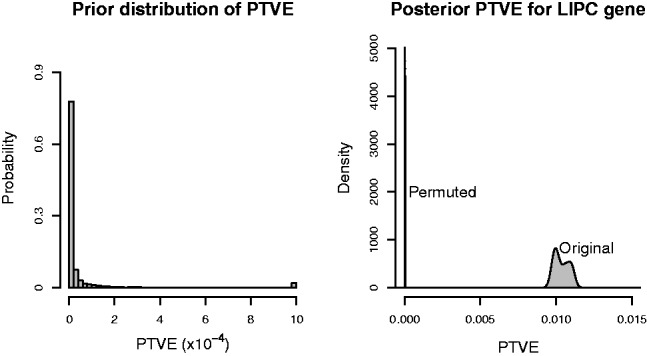
Fig. 2.

Prior and posterior distributions for the proportion of total variation explained (PTVE) by the model. The panel on the left shows the prior distribution imposed on the proportion of total variation of the phenotypes explained by the SNPs under consideration (here, the SNPs from the LIPC gene). The median of the prior distribution is located at ∼4e-6. The characteristic features of the prior distribution include the peak at values close to zero, effectively removing noise unless there is strong evidence about a possible association, and the long tail allowing a small percentage of genes to explain larger proportions of the phenotype variation. The rightmost bin on the x-axis contains the total probability of values exceeding the maximum value on the axis. The panel on the right shows the posterior distribution of the PTVE for the same SNPs. Two posterior densities are shown, one showing the distribution for the original data, the other showing the distribution for data in which the rows of the phenotype matrix have been permuted. Notice the differing scales on the x-axes of the two panels
