
Fig. 3.
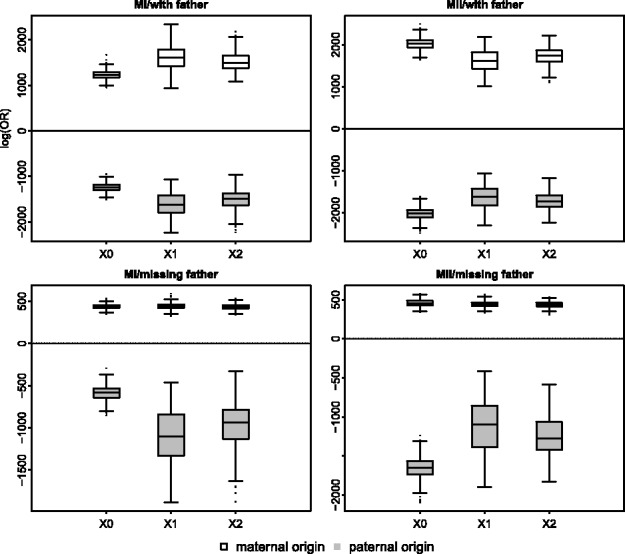
Boxplots of the log OR [ ] using triploid data from the proband and using data from EUR. Each panel represents one of four possible simulated cases: disjunction occurring at MI or MII, with or without available data for the father. The number of crossovers is shown on the x-axis