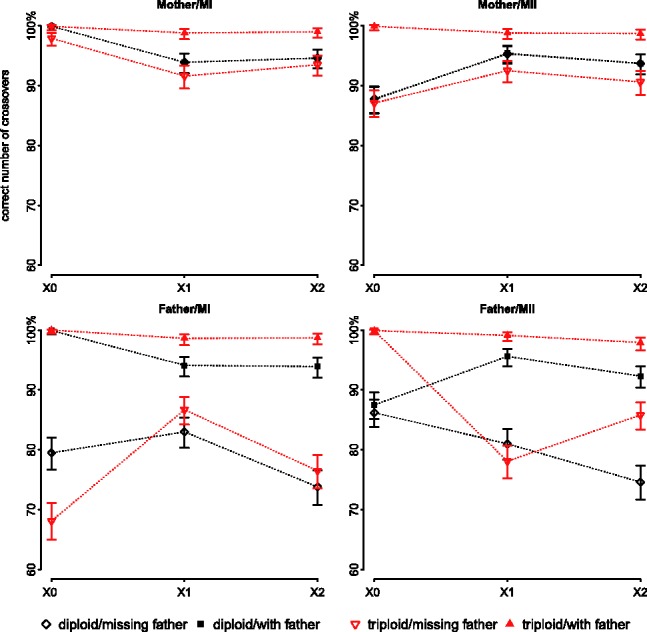
Fig. 5.

Percentages of observable crossovers that are correctly identified for each of four possible simulated cases (disjunction occurring in the father or the mother, during MI or MII), assuming equal prior odds for MI versus MII. The error bars represent the 95% confidence intervals. The true number of observable crossovers is indicated on the x axis. We emphasize that only a subset of crossovers that occurred on the tetrad is observable, [Equations (1) and (2)]
