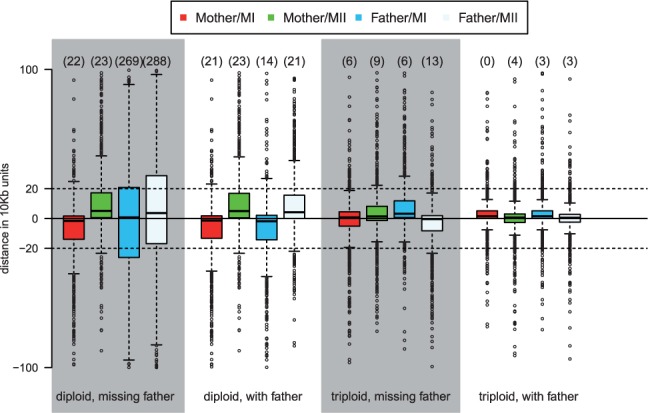
Fig. 6.

Distance between inferred and true crossover locations in EUR simulations with one crossover, conditional on inferring the right number of crossovers. On the y axis is the distance in units of 10 kb (the average distance between adjacent SNPs). The numbers on top of each box represent the number of outliers outside of the plotted range (−100, 100)
