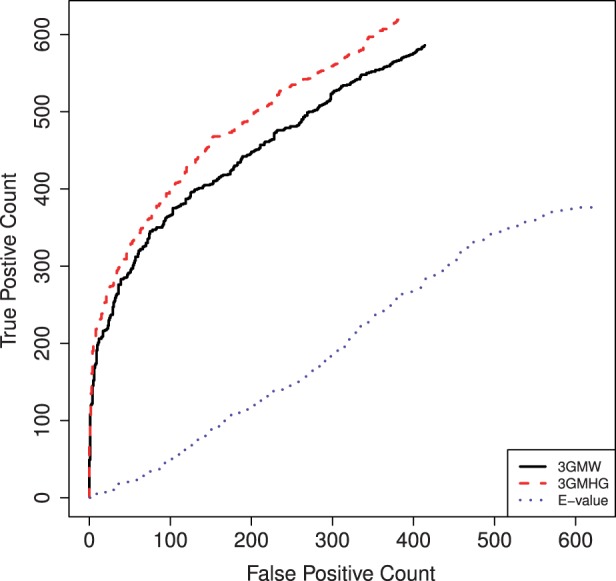
Fig. 4.

ROC-like plots of two-tiered versus E-value motif scores in ZOOPS mode. An optimal motif is selected in each set using the E-value, selective MHG (3GMHG) or selective MW (3GMW). If the Tomtom assigned P-value to the match between each selected motif and the implanted one is  , we label the selected motif as positive otherwise as negative. Varying the significance threshold, we plot the number of positive motifs that are deemed significant (TP) versus the number of negative motifs that are called significant at that level (FP). The significance is determined either by the E-value or by the 3-Gamma point estimate of the P-value (3GMW, 3GMHG). As the optimal motif might vary with the method, we plot FP versus TP counts rather than the usual ROC curve
