
Figure 6.
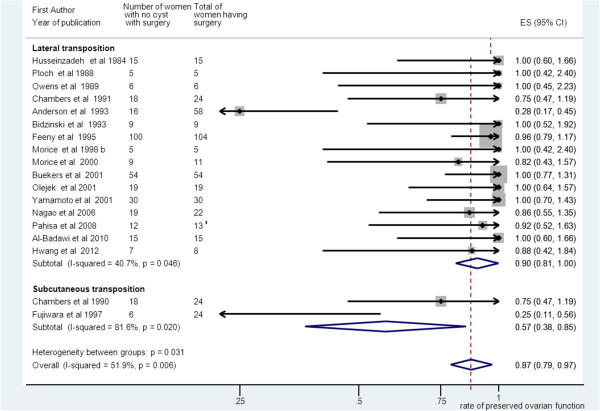
Funnel plot of the random-effect estimates of the individual studies for ovarian preservation. The vertical line indicates the random-effects summary estimate (using inverse-variance weighting) while the sloping lines indicate the 95% confidence intervals. Little heterogeneity was observed.