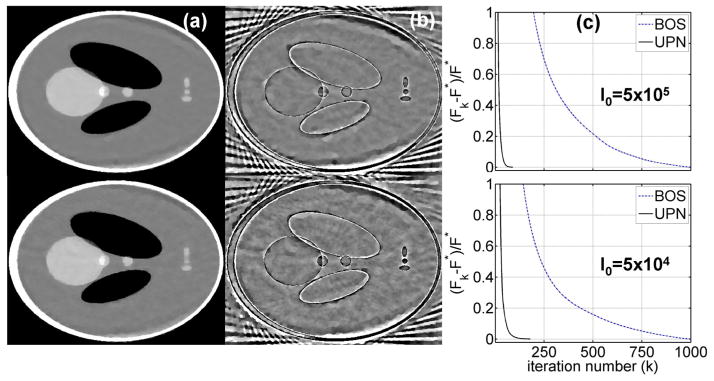
FIG. 3.

Comparison between BOS and UPN algorithms on the digital Shepp-Logan phantom. A total of 66 projections are used in the study. Row (1): using a simulated noise level of I0=5×10⁵ photons per ray; (2): using I0=5×10⁴. Column (a): reconstructed CT image using BOS with the same computation time as those required to obtain the UPN results shown in Fig. 2(a) (100 seconds for the 1st row and 57 seconds for the 2nd row), display window: [−500 500] HU; (b) difference image compared with the ground truth, display window: [−100 100] HU; (c) 1d plot of the objective function values versus the iteration number.
