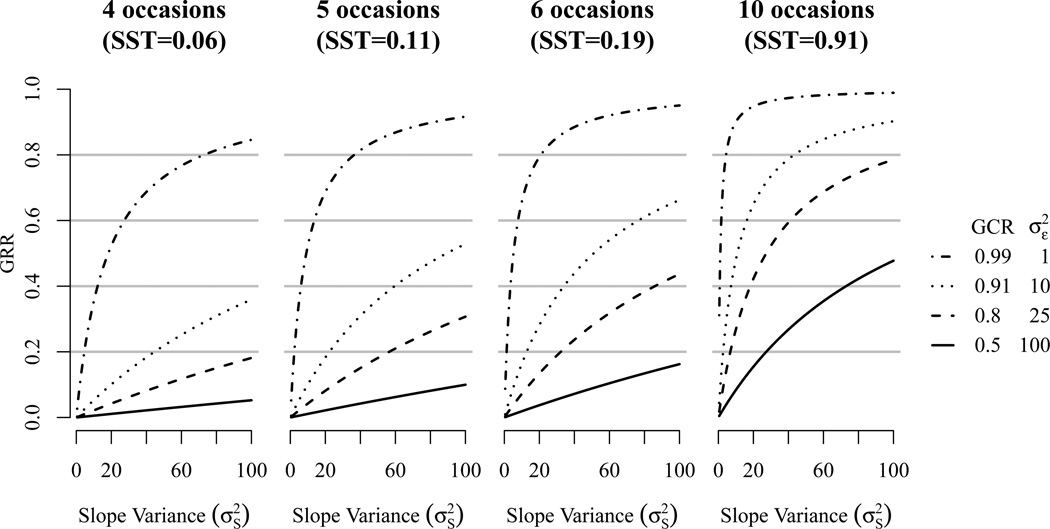
Figure 2.
GRR as a function of slope variance () among different numbers of measurement occasions. The four lines are based on four different error variances. The Figure parallels the power plots in Hertzog et al. (2008, Figure 3) and shows how GCR is related to GRR. 4 occasions cover a study duration of 6 years, 5 occasions cover 8 years, 6 occasions cover 10, and 10 occasions cover 18 years.

