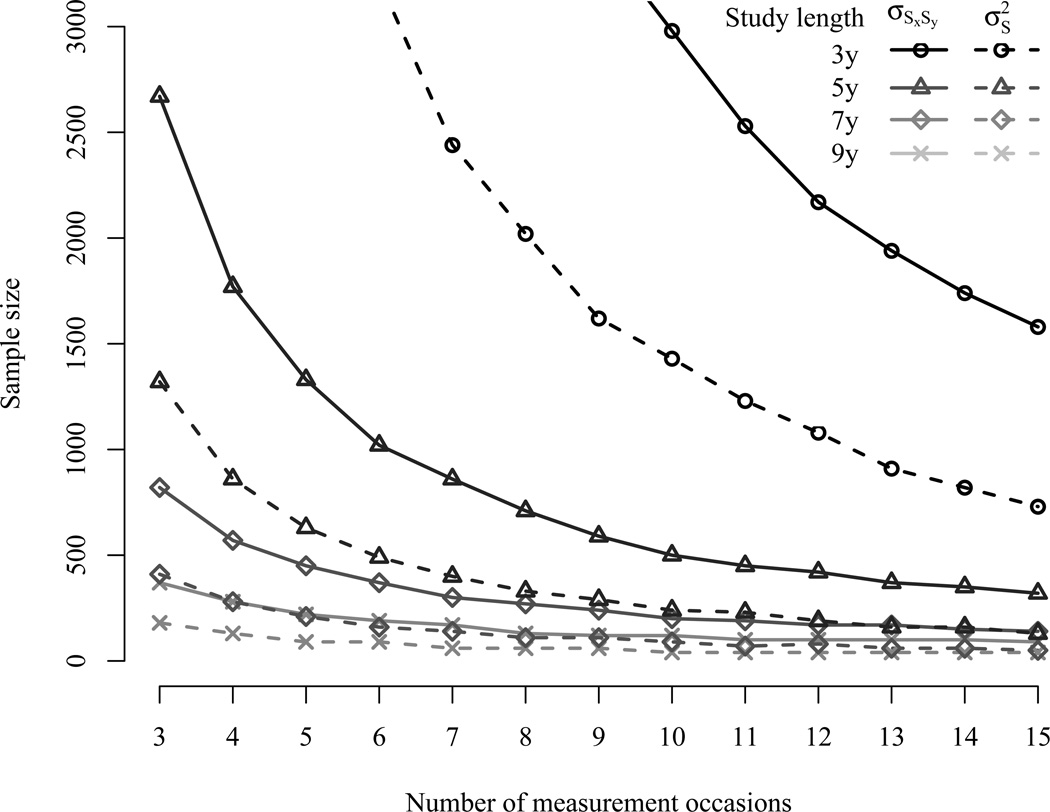
Figure 7.
Power curves for covariances among slopes (solid lines) and slope variances (dashed lines) given and a correlation (r = .50) among the slopes. The lines represents four study durations covering 3, 5, 7, and 9 years in total with equidistant intervals. The number of measurement occasion for each of these four study length varied from 3 to 15.

