
Figure 7. Effect of Pharmacological Inhibitors on GILZ Induction by CT.
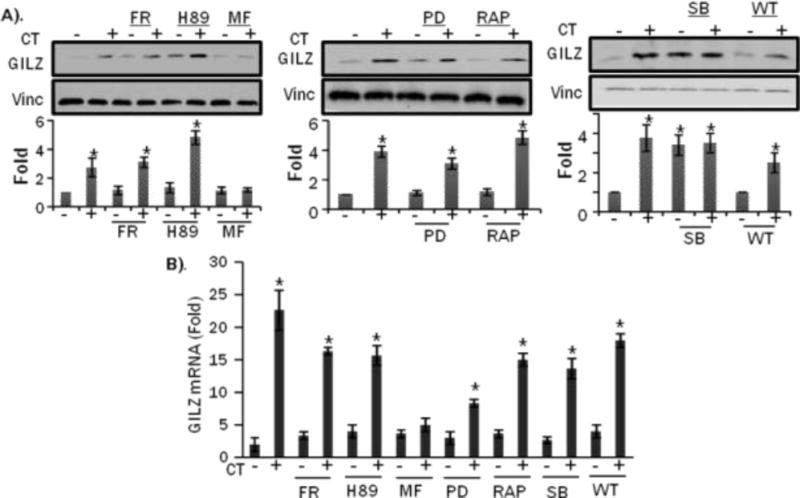
H9c2(2-1) cells were treated with ERK inhibitor (FR180204, 10 M), PKA inhibitor (H89, 10 M), GR inhibitor Mifepristone (MF, 1 M), MEK inhibitor (PD98059, 10 M), mTOR inhibitor Rapamycin(RAP, 5 ng/mL), p38 inhibitor (SB202190, 10 M), or PI3 Kinase inhibitor Wortmaninn (WT, 100 nm) for 1 hr before 1 M CT treatment for 8 hrs. Proteins or total RNA were harvested from these cells for Western blot (A), or real time RT-PCR (B). The intensities of the bands were quantified and significant difference between CT plus drug treated from drug control, as indicated by * (p<0.05), was determined as described in Figure 2.