Fig. 4.
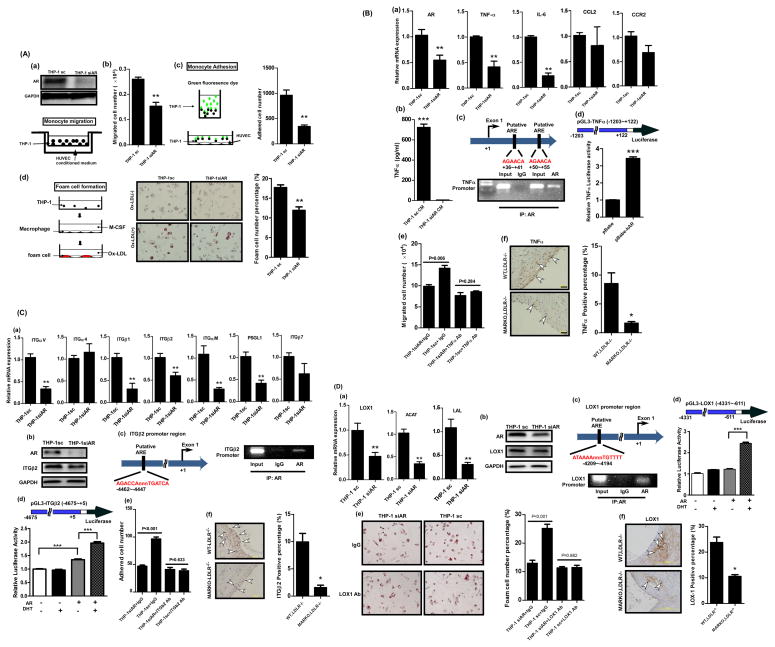
Fig. 4A. AR in THP-1 cells play a stimulatory role to promote the migration and adhesion to HUVECs and foam cell formation. a. THP-1siAR and THP-1sc, and HUVECs conditioned media (CM) were placed in transwell plates as described in the cartoon (lower panel). b. The migrated cells were stained and the positively stained cells numbers were measured. **p<0.01 c. THP-1siAR and THP-1sc, were tagged with GFP and then incubated with HUVECs. The adhered THP-1 cells with green fluorescence were counted. Quantitation is shown on the right. Magnification, 100x. **p<0.01 d. The THP-1siAR and THP-1sc cells were induced to differentiate into macrophage by M-CSF. The cells were then incubated with oxLDL to evaluate the ability of cells to uptake oxLDL (cartoon in left panel). At the end of reaction, cells were stained with filtered Oil-red-O (middle panel). Magnification, 100x. Quantitation is shown on the right. **p<0.01.
Fig. 4B. The AR in THP-1 cells promotes migration to HUVECs. a. qPCR analysis testing mRNA expression levels of candidate molecules involved in migration process. **p<0.01 b. ELISA test showing TNF-α secretion by the THP-1siAR and THP-1sc cells. ***p<0.001 c. ChiP assay. AR antibody was used to pull down TNFα promoter region which contains androgen response elements (AREs) (upper panel). d. TNFα promoter transactivation was measured using luciferase constructs containing AR binding sites of the promoter region of TNF-α molecule in the presence of pBabe vector only or pBabe-AR. HEK-293 cells were used in this assay. e. Blocking effect of migration of THP-1 cells to HUVECs upon incubation with the TNF-α antibody. f. IHC staining of TNF-α in aortic tissues obtained from the MARKO-LDLR−/− and WT-LDLR−/− mice. Arrowheads indicate positive stained areas. Magnification, 100x. Quantitation is shown on the right. *p<0.05, **p<0.01, and ***p<0.001.
Fig. 4C. The AR in THP-1 cells promotes adhesion to HUVECs. a. qPCR analysis testing mRNA expression levels of candidate molecules involved in adhesion process, **p<0.01. b. Western blot analysis showing AR and ITGβ2 in the THP-1siAR and THP-1sc cells. GAPDH was used as control. c. ChiP assay. AR antibody was used to pull down ITGβ2 promoter region which contains AREs. d. ITGβ2 promoter transactivation was measured using luciferase construct containing ITGβ2 promoter region in the presence or absence of AR with or without DHT. HEK-293 cells were used in this assay. e. Blocking effect of adhesion of THP-1siAR and THP-1sc cells onto the HUVECs upon incubation with the ITGβ2 antibody. f. IHC staining of ITGβ2 in aortic tissues obtained from the MARKO-LDLR−/− and WT-LDLR−/− mice. Magnification, 400x. Arrowheads indicate positive stained area. Quantitation is shown on the right. *p<0.05, **p<0.01, and ***p<0.001.
Fig. 4D. The AR in macrophages promotes foam cell formation. a. qPCR analysis testing mRNA expression levels of candidate molecules involved in foam cell formation process. **p<0.01 b. AR and LOX-1 expression levels were determined using western blot in THP1-sc and THP1-siAR cells. GAPDH served as loading control. c. LOX-1 promoter region containing ARE (upper) was pulled down with AR antibody and amplified with primers specific targeting ARE region (lower). d. LOX-1 promoter region was constructed to pGL3 luciferase vector. The LOX-1 promoter transactivation was measured in the presence or absence of AR with or without DHT. e. Blocking effect on foam cell formation upon incubation with the LOX-1 antibody. Quantitation is shown on the right. f. IHC staining of LOX-1 in aortic tissues obtained from the MARKO-LDLR−/− and WT-LDLR−/− mice. Magnification, 100x. Quantitation is shown on the right. *p<0.05, **p<0.01, and ***p<0.001.

