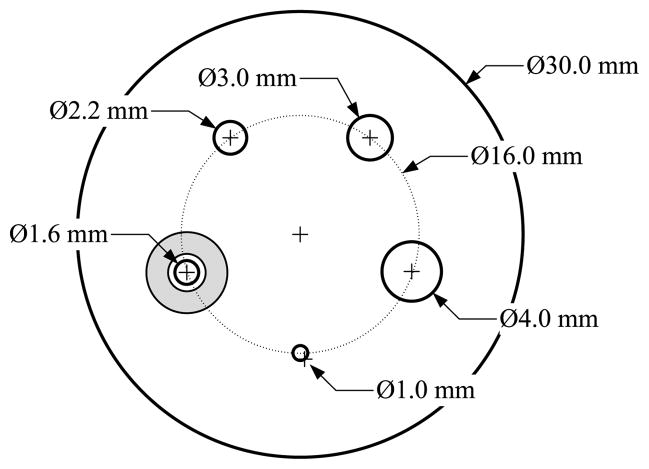
Figure 4.
The cross section of the computer-simulated phantom. The shaded region shows an example of a cross section of a selected background region which is used to calculate the mean background activity surrounding the enclosed sphere. Other background regions are selected in a similar fashion. The largest sphere is a cold sphere whose activity ratio to the warm background is 1:10, and the other four spheres are hot spheres with an activity ratio of 5:1.

