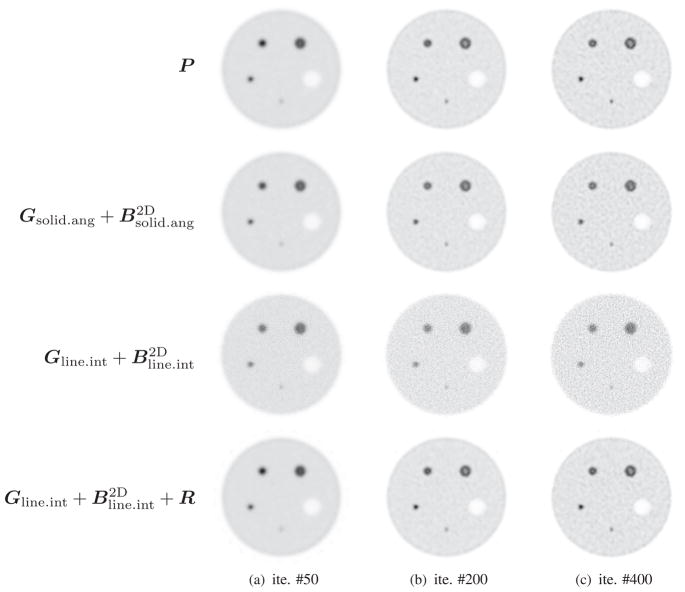
Figure 5.
A comparison of central transaxial slices of reconstructed images using different system models. The first row shows the results based on the accurate system matrix, the second row shows the results based on the factorization model and the third and the fourth rows correspond to the proposed factorization model without and with the image blurring matrix R, respectively.

