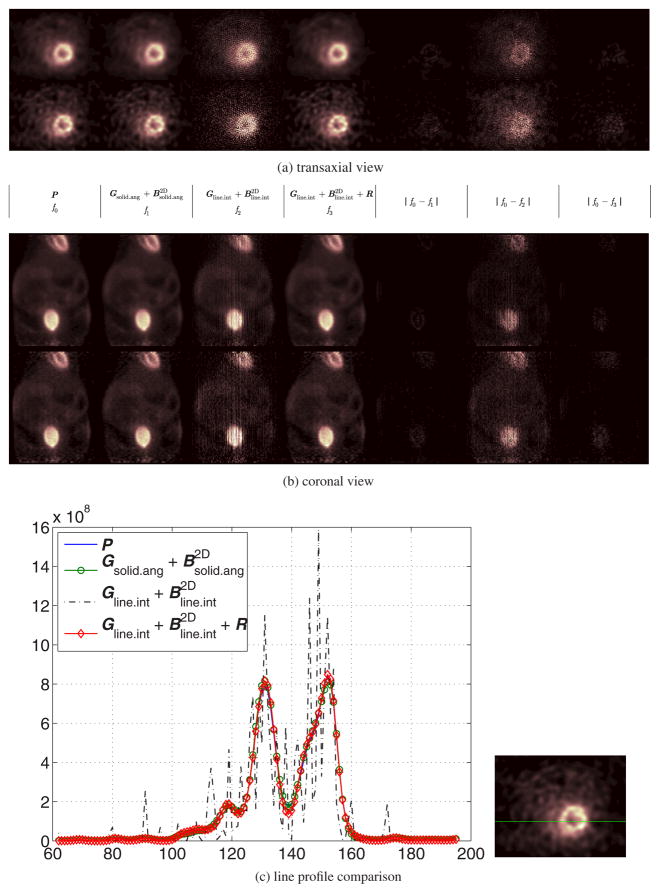
Figure 9.
Comparison of reconstructed images of the real mouse data. In both (a) and (b), there are two rows corresponding to reconstructed images at the 50th (top) and 200th (bottom) iterations, respectively. The first column shows the reconstructed images using the accurate system matrix P; The second shows reconstructed images using ; The third and fourth columns are results of without and with the image blurring matrix , respectively. The fifth column is the absolute difference image between the result of the accurate system matrix and the result of ; The sixth and the last column are the absolute difference images between the results of the accurate model and the results based on the sparse factorization model without and with the image domain blurring matrix, respectively. Here the image size has been truncated for better visualization. (c) Line profiles through the reconstructed myocardium at the 200th iteration using different system models. The location of these profiles is indicated by the horizontal line in the right image. (a) Transaxial view, (b) coronal view and (c) line profile comparison.

