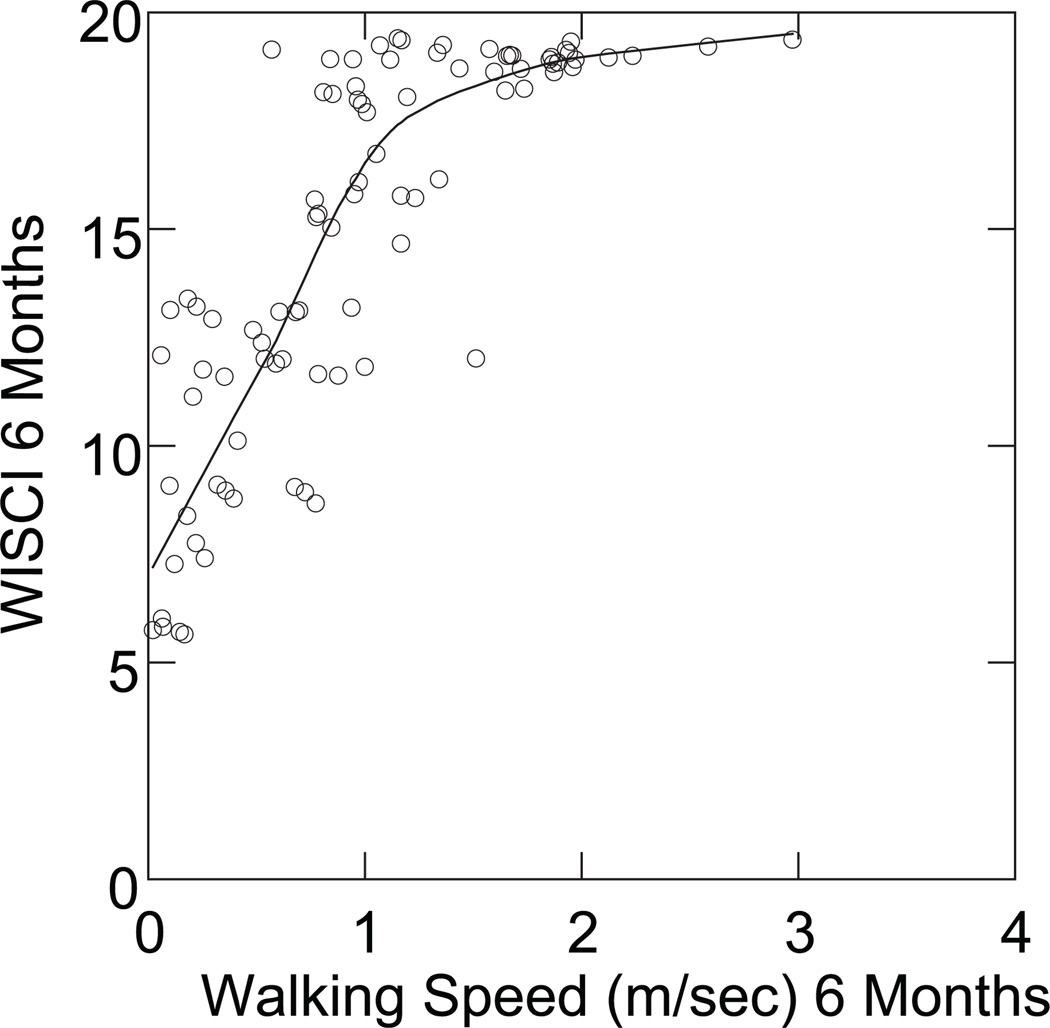
Figure 2.
Comparison of Walking Index for Spinal Cord Injury (WISCI) levels to the speed of the 50-foot walk at 6 months (r = .73), demonstrating a ceiling effect of the WISCI scale. Many data points in these data will overlap and show as a single point. To avoid this and show the actual number of points, the plots were done with added “jitter.” That is, points are offset a small amount from their actual values in order to not overlap. The trend line is a nonparametric smoother to show trend without an a priori assumption as to the form of the trend.

