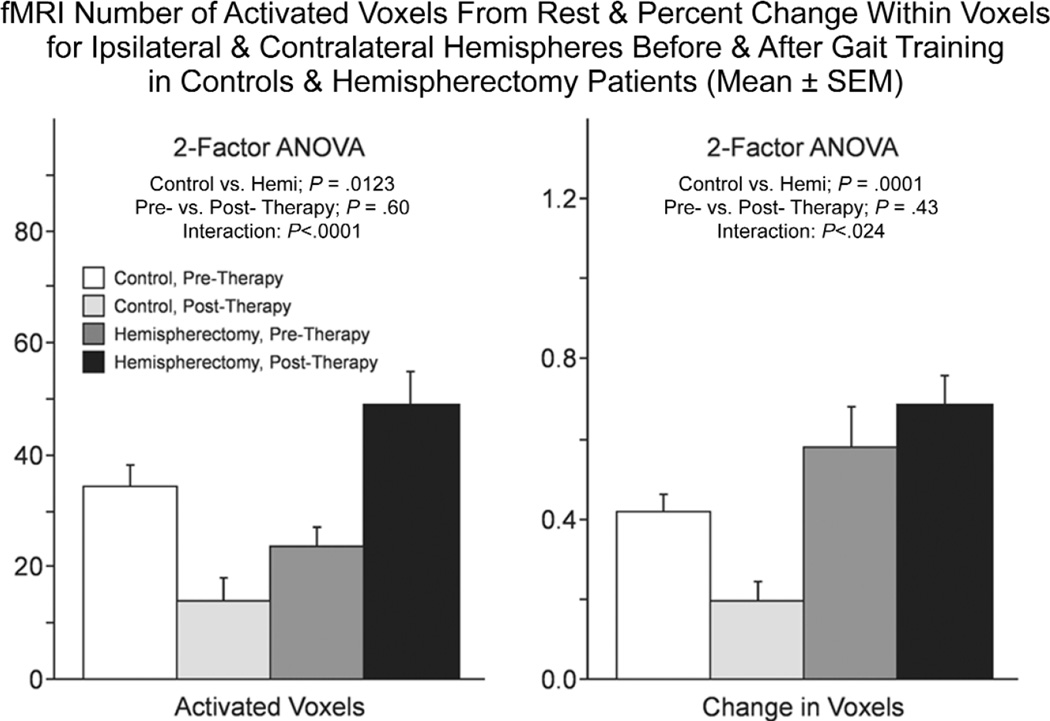
Figure 5.
Bar graphs showing the number of activated voxels (left) and percent change in intensity (right) between rest and vol-untary ankle movement activations pre- and postgait training for controls and hemispherectomy patients. The mean (± SEM) using repeated measures for all 4 regions of interest (ROIs) and paretic and nonparetic foot movements combined are shown. Statistical results of the repeated measures 2-factor analysis of variance (ANOVA) for all ROIs are indicated above each set of bar graphs.

