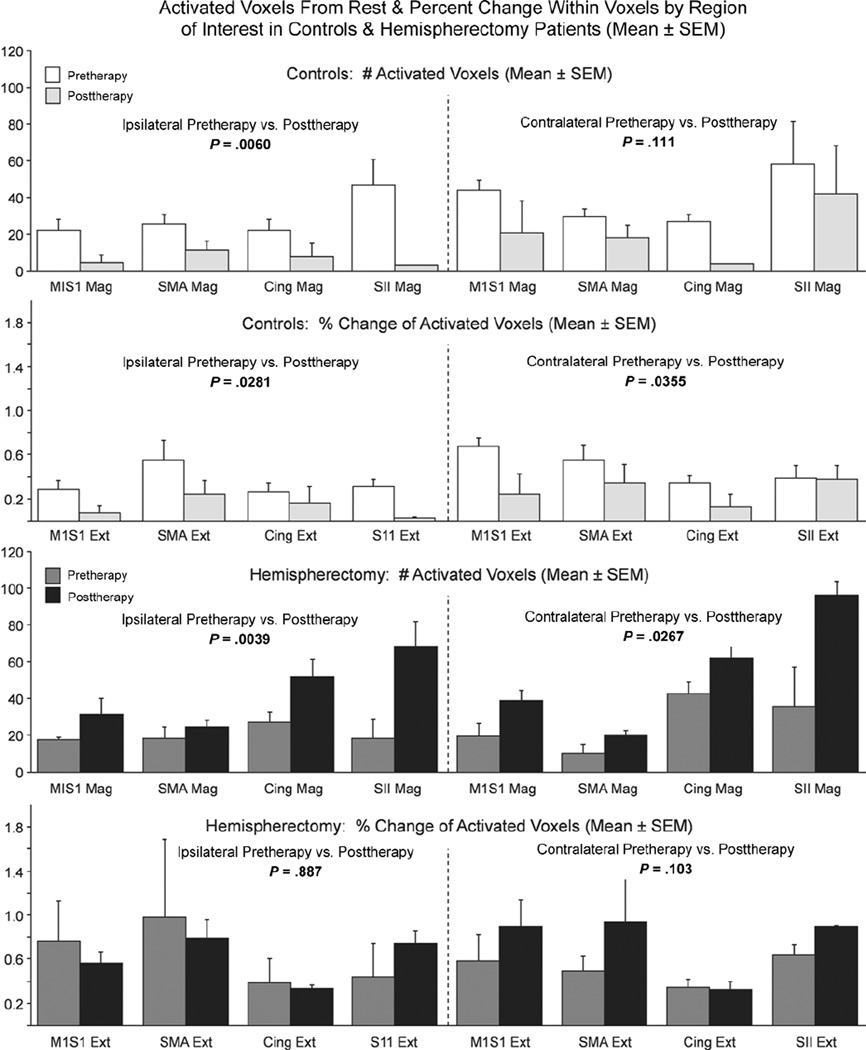
Figure 6.
Bar graphs showing the number of activated voxels (top and third row) and percent change in intensity (second and fourth rows) for controls (top and second row) and hemispherectomy patients (third and fourth rows) for each region of interest (ROI) with ipsilateral paretic and contralateral nonparetic voluntary ankle movement. Results of repeated-measures analysis of variance for the 4 ROIs are indicated for ipsilateral and contralateral voluntary ankle movements. SMA, supplementary motor area; SII, secondary somatosensory area.

