
Figure 5. Modified version of the diagram proposed by Rowell (1993).
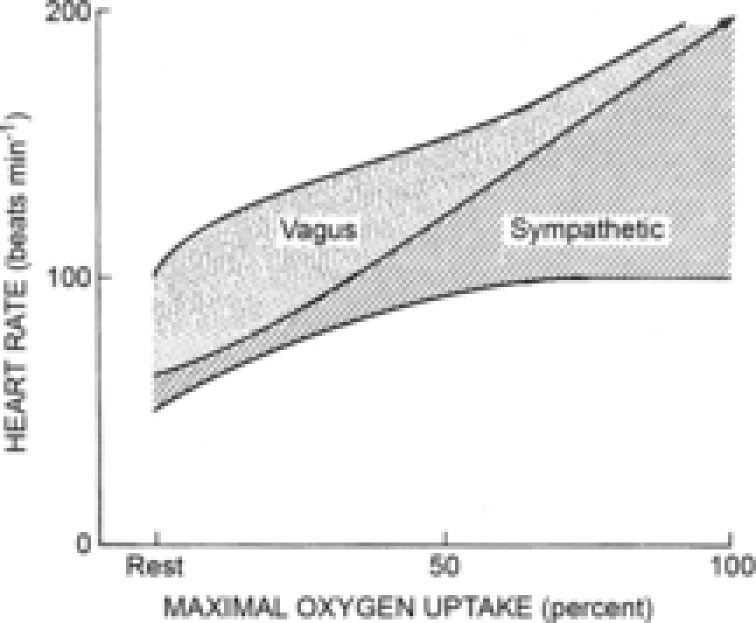
The modified diagram (Fig. 5–4, Rowell 1993) depicts the reflex continuum of autonomic influence from both branches of the autonomic nervous system throughout exercise. The shaded area under the central line represents the sympathetic influence at all exercise workloads. The dotted area represents the functional parasympathetic modulation of heart rate (HR) at all exercise workloads. As the area of the sympathetic portion of the graph increases, the area of the parasympathetic modulation portion of the graph decreases to show the inverse relationship between sympathetic tone and parasympathetic modulation. The centre line indicates the relative HR (i.e. dynamic sympatho–vagal balance).