
Figure 2. Left ventricular fibrosis in LC, ZDF and Z-Resv rats.
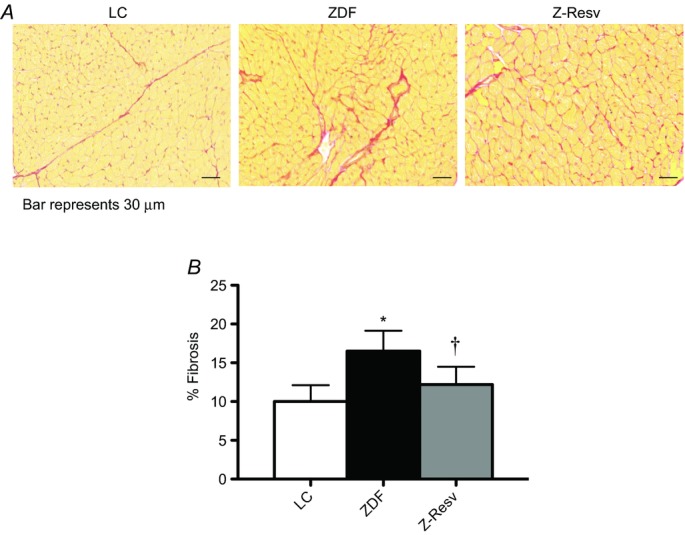
Representative images are shown at ×4.2 magnification, and the black bar represents 30 μm. Values represent means ± SEM. n = 4–5. *Significantly (P < 0.05) different from LC. †Significantly (P < 0.05) different from ZDF.