
Figure 5. Markers of electron transport chain protein content in the left ventricle of LC, ZDF and Z-Resv rats.
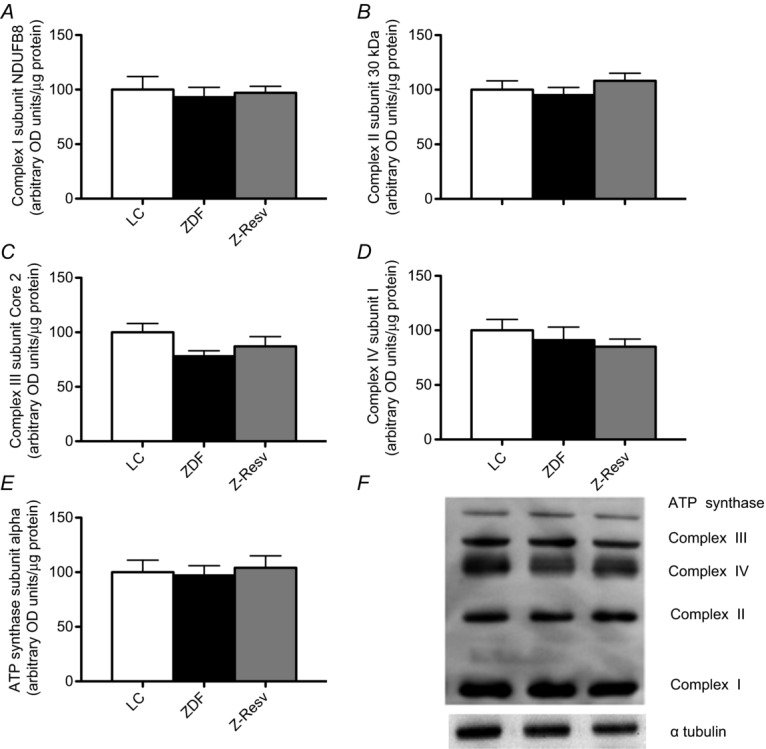
Complex I subunit NDUFB8 (A), complex II subunit 30 kDa (B), complex III subunit core 2 (C), complex IV subunit I (D), ATP synthase subunit α (E) were analysed and no significant differences were found. A representative OXPHOS blot, as well as α-tubulin which was used as a loading control, is shown in F. Values represent means ± SEM, n = 7 for all conditions, and 5 μg was loaded for all samples.