
Figure 5. Histogram distributions of individual MyHC fibre CSA following 12 weeks of aerobic training demonstrate rightward shifts.
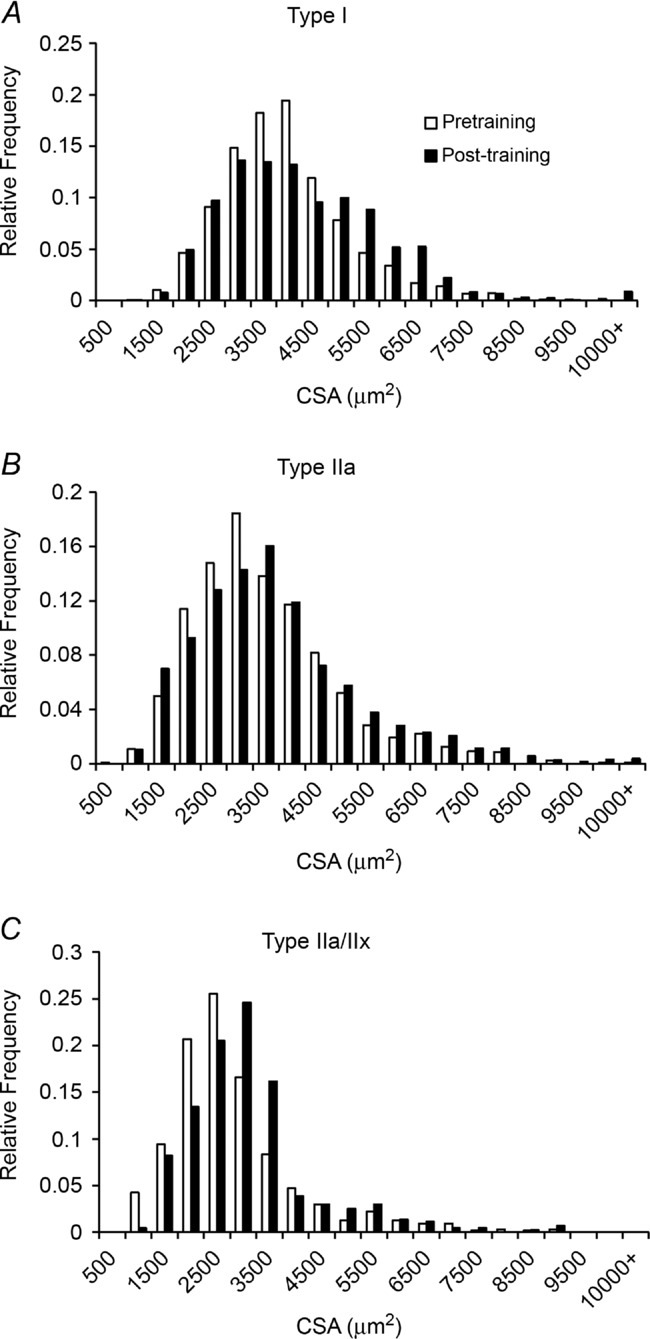
Myosin heavy chain type I CSA presented as a binned histogram (A), MyHC type IIa CSA presented as a binned histogram (B) and MyHC type IIa/IIx CSA presented as a binned histogram (C).