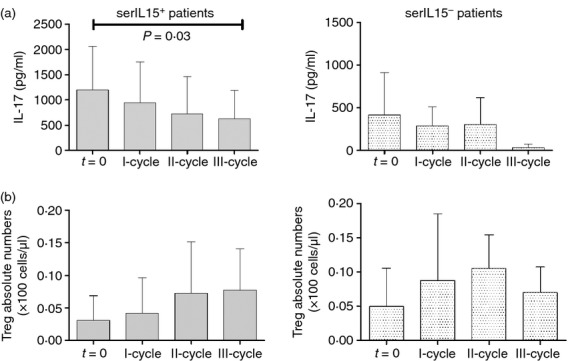
Figure 5.

(a) Serum interleukin-17 (IL-17) levels after rituximab treatment in patients segregated according to serum IL-15 levels: serIL-15+ (baseline and I cycle n = 25, II-cycle n = 17 and III-cycle n = 13) and serIL-15− (baseline and I-cycle n = 8, II-cycle n = 6 and III-cycle n = 4) patients. (b) Regulatory T (Treg) cell counts after rituximab treatment. Results were expressed as the mean and error bars represent SD. P-values correspond to the comparison of baseline values with III-cycle by Wilcoxon test for paired samples.
