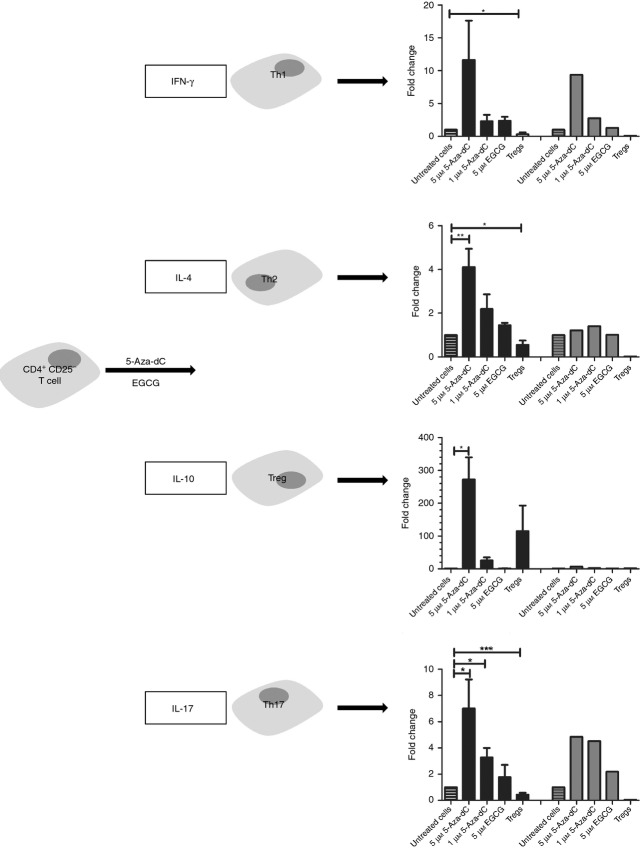
Figure 8.
Effects of demethylating agents on leading cytokine expression. Expression was quantified by real-time PCR (black bars) and by mRNA expression by array analysis (grey bars) after stimulation of CD4+ CD25− T cells with 5-aza-2′-deoxycytidine (5-Aza-dC) and epigallocatechin-3-gallate (EGCG) for 7 days. *P < 0·05, **P < 0·01, ***P < 0·001.

