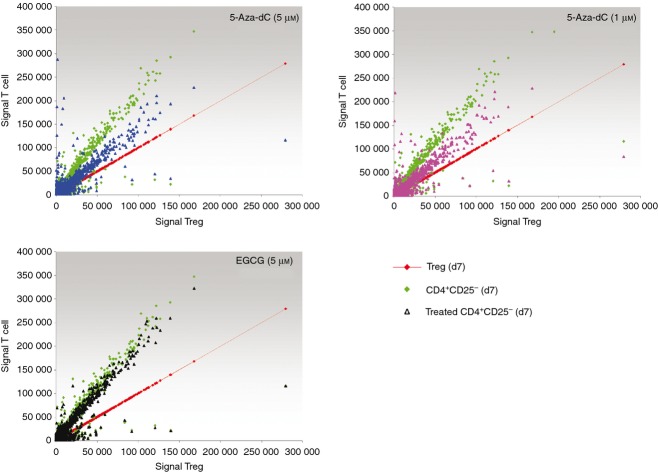
Figure 9.
Effects of demethylating agents on expression profiling of regulatory T (Treg) -regulated genes. Gene expression microarray analysis of CD4+ CD25− T cells treated with either 5-aza-2′-deoxycytidine (5-Aza-dC) at a final concentration of 5 μm (5-Aza-DC (5 μm), blue triangle) or 1 μm [5-Aza-DC (1 μm), pink triangle] and epigallocatechin-3-gallate (EGCG) (5 μm), black triangle). Genes with at least twofold change of expression intensity between regulatory T cells and CD4+ CD25− T cells are considered. Gene expression intensity for Treg cell genes is shown on the x-axis, gene expression intensity of the comparative cell on y-axis. This results in a bisecting red line for Treg cells as comparative population. Green diamonds show the CD4+ CD25− T cells (CD4+ CD25−; d7), compared with Treg cells.

