
Figure 1.
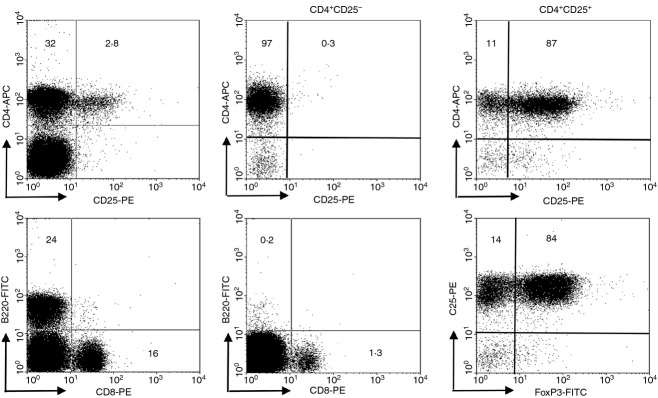
Phenotypic characterization of isolated T cells. Plots display the fractions of CD4+ T cells in reference to CD25 expression, CD8+ T cells and B lymphocytes before isolation (left panels). Isolation CD4+ CD25− T cells yields low contamination with CD4+ CD25+ T cells and CD8+ T cells (middle panels). The CD4+ CD25+ subset contains ∼ 10% CD4+ CD25− T cells and ∼ 85% express FoxP3 (right panels).