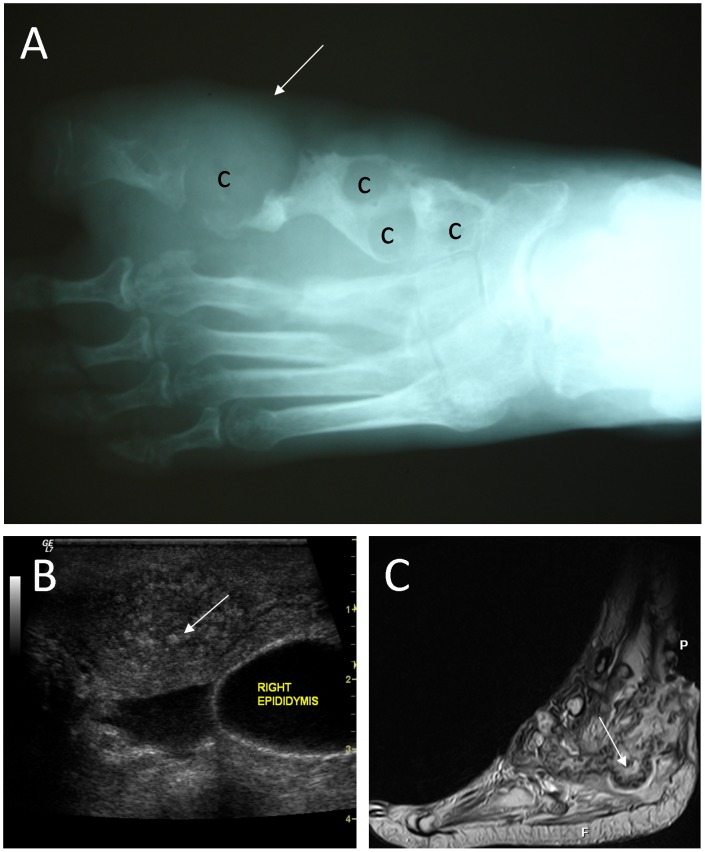
Figure 2. Imaging techniques used in mycetoma.
A: A radiograph of the foot, showing soft tissue shadow (arrow), and multiple large cavities (c) in line with eumycetoma. B: A typical sonogram of scrotal eumycetoma. In this sonogram multiple cavities with thick walls and multiple hyper-reflective echoes (arrow) are seen, which are in line with grains. C: An MRI of the foot, showing massive soft tissue and bone destruction. In this MRI, grains appear as conglomerates of small (2–5 mm) round hyperintense lesions (arrow).

