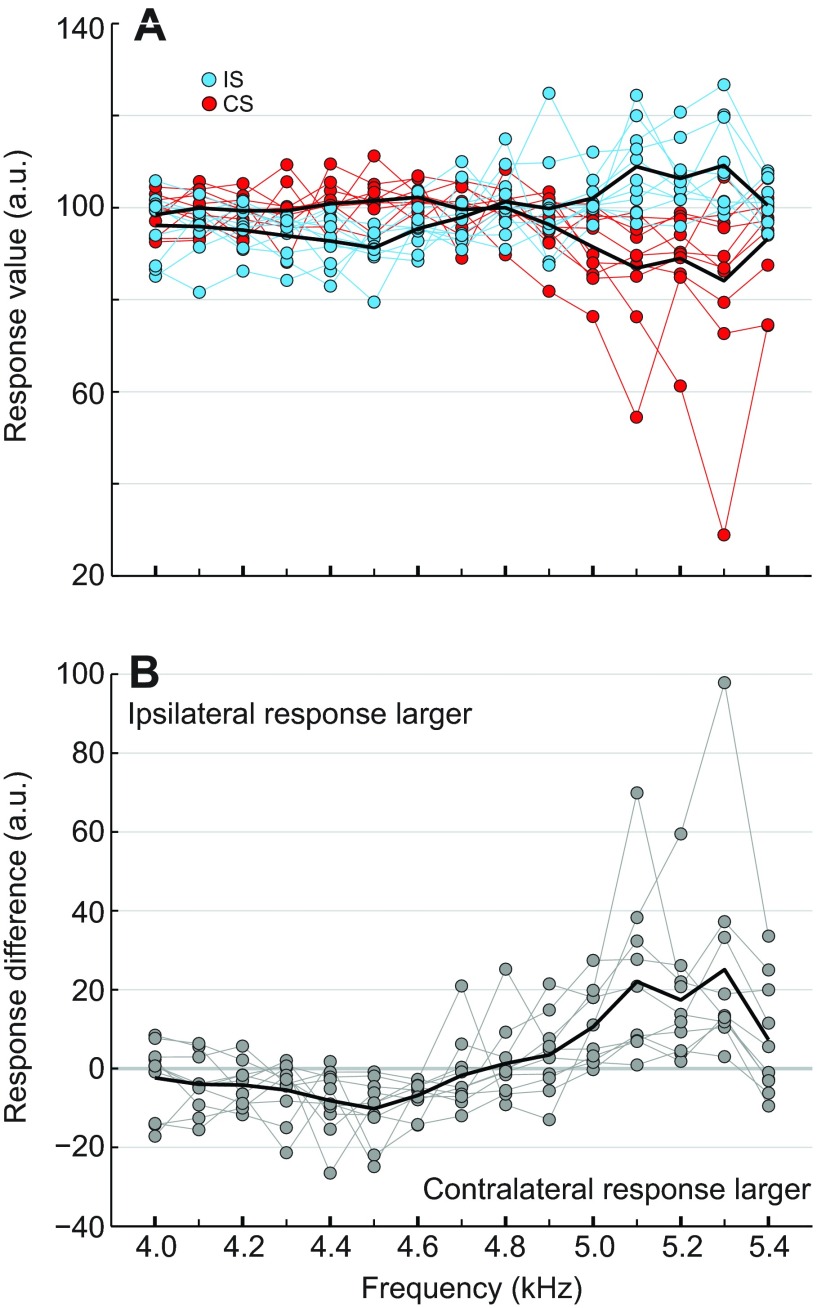
Fig. 3.
Summed neuronal activity of the auditory afferents measured in response to 90 deg phase-shifted sound stimuli. (A) Normalised neuronal responses from individual crickets to the ipsilateral (IS, blue circles) or contralateral speaker (CS, red circles) leading in phase by 90 deg (n=10). Original neuronal responses were normalised at each respective carrier frequency using reference neuronal responses to 75 dB SPL pulses from the ipsilateral speaker (a.u.; see Materials and methods). (B) Difference between the normalised individual neuronal responses to the ipsilateral and contralateral speaker leading in phase by 90 deg (grey circles), and the average difference across all crickets (black line).

