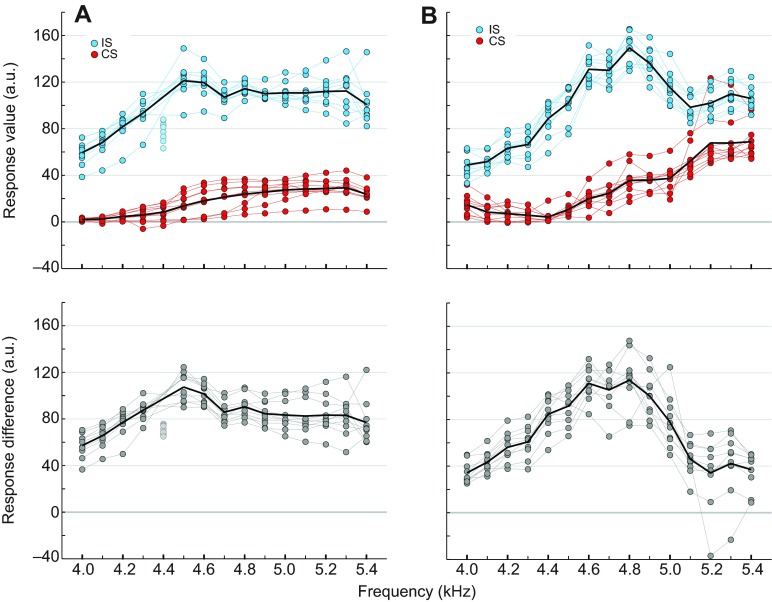
Fig. 4.
Frequency tuning curves measured from tympanic membrane velocity responses to sound stimuli presented with conical and free-field speakers. (A) Conical speakers. (B) Free-field speakers. The top panels show normalised tympanic membrane responses from individual crickets to sound stimuli presented from the ipsilateral (blue circles) and contralateral (red circles) speakers (n=10). Original tympanic membrane velocity responses were normalised with reference to the mean of the ipsilateral responses across all carrier frequencies (a.u.; see Materials and methods). The bottom panels show the difference between the normalised responses to ipsilateral and contralateral stimulation of individual crickets (grey circles), and the average difference across individuals (black line). The best frequency tuning is expected to occur at the largest difference between the responses to ipsilateral and contralateral stimulation. Lighter coloured dots refer to data points that were not included in the analysis; see Materials and methods for details.

