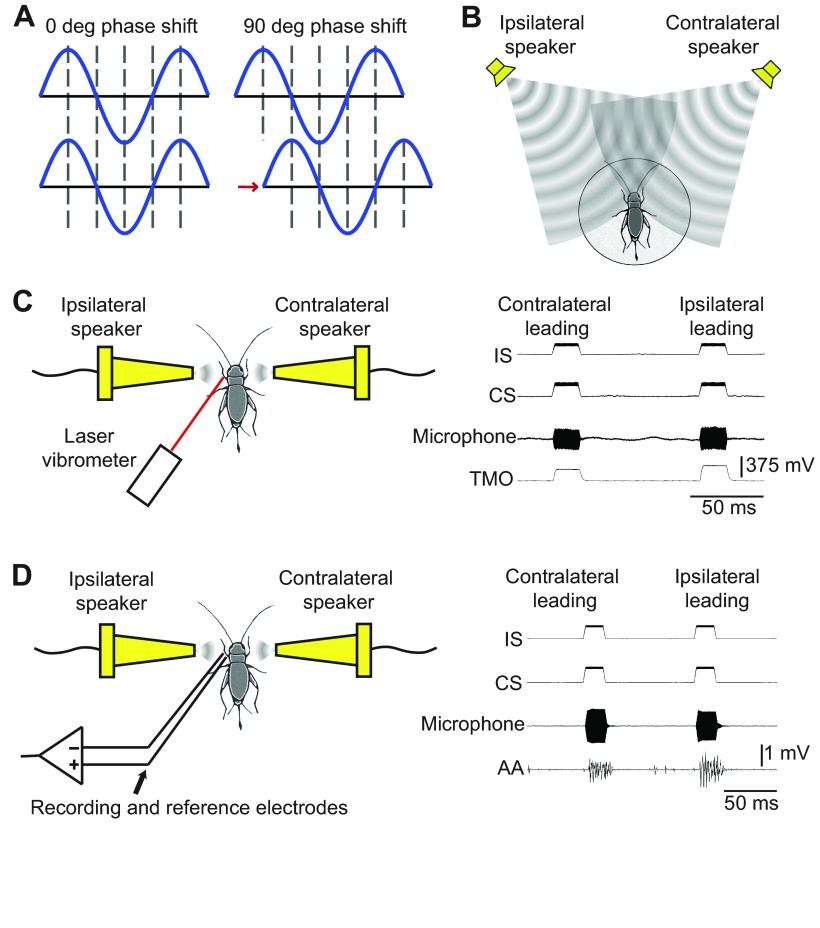
Fig. 5.
Schematics of experimental methods. (A) Diagram of a 90 deg phase shift in a sinusoidal sound wave, including a time delay (shown for clarity, but not considered experimentally). (B) Cricket steering in response to free-field sound stimuli presented from two speakers positioned at ±45 deg off the insect's length axis. (C) Laser vibrometry measurements of the left posterior tympanic membrane's velocity in response to sound stimuli presented from conical speakers (left), and example traces of the ipsilateral speaker (IS), contralateral speaker (CS), microphone and laser vibrometer measurements of tympanic membrane oscillations (TMO) during two sound pulse presentations (right). (D) Extracellular recordings of the left tympanal nerve in response to sound stimuli presented from conical speakers (left), and example traces of the IS, CS, microphone and auditory afferent activity (AA) during two sound pulse presentations (right).

